 2
2peptides
spectra
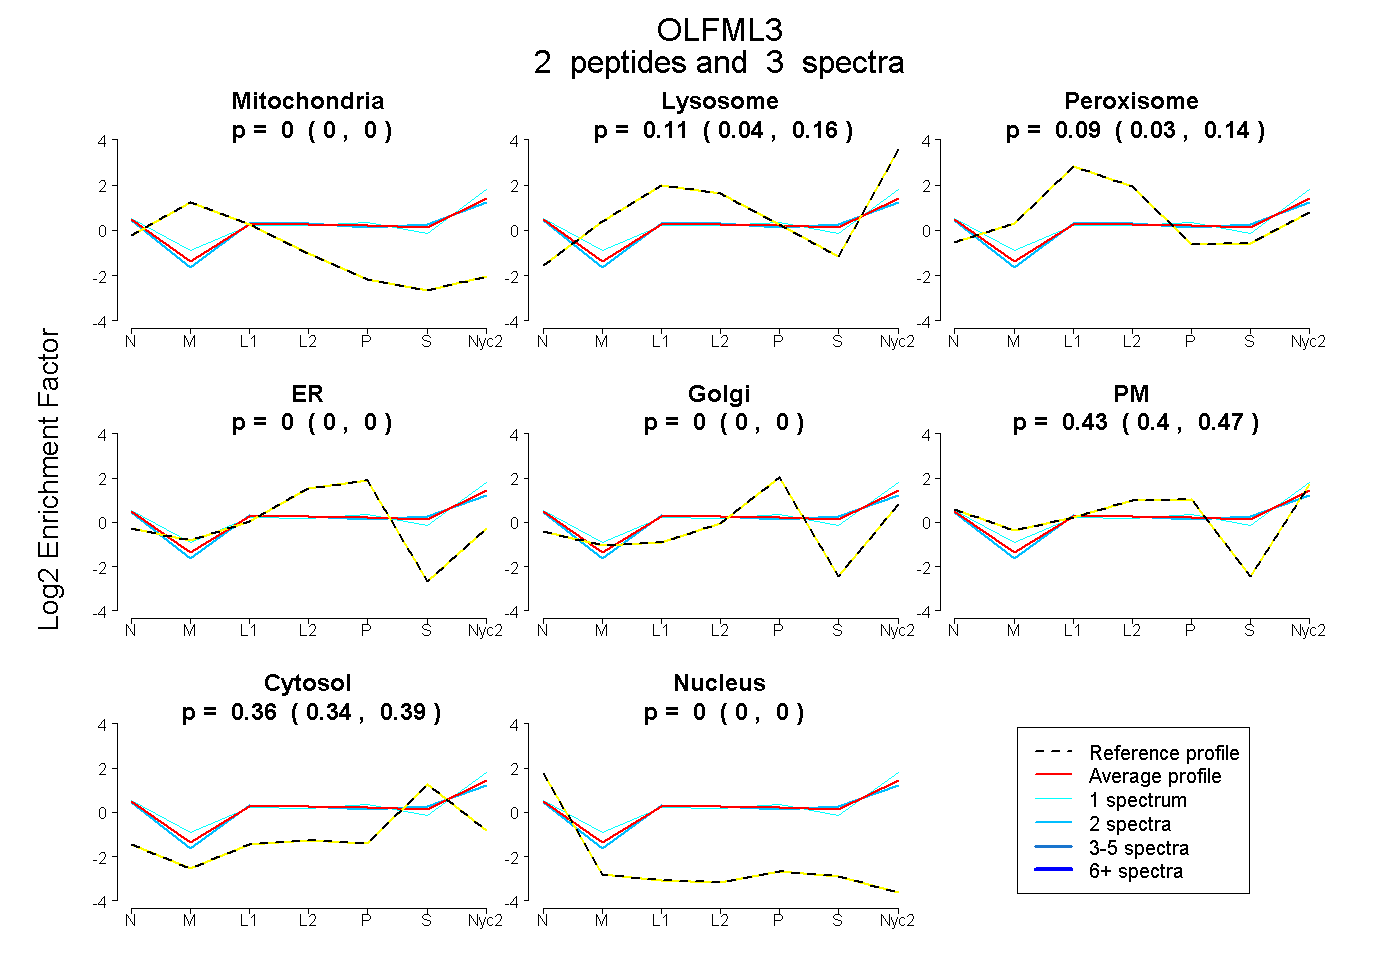
0.000 | 0.000
0.044 | 0.165
0.031 | 0.143
0.000 | 0.000
0.000 | 0.000
0.395 | 0.466
0.335 | 0.386
0.000 | 0.000
4peptides
spectra
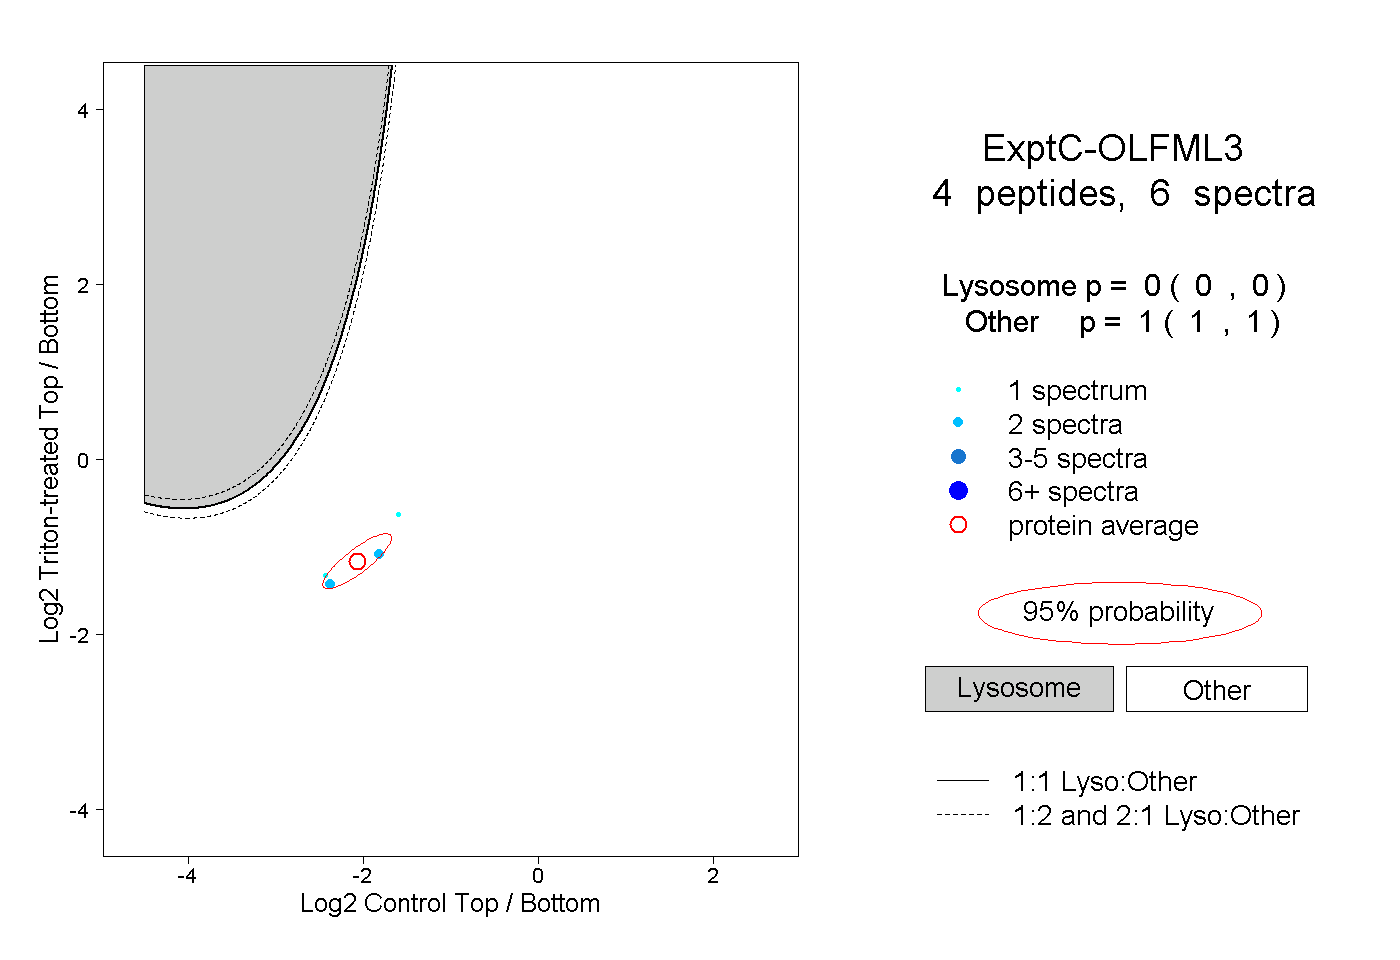
0.000 | 0.000
1.000 | 1.000
1peptide
spectrum
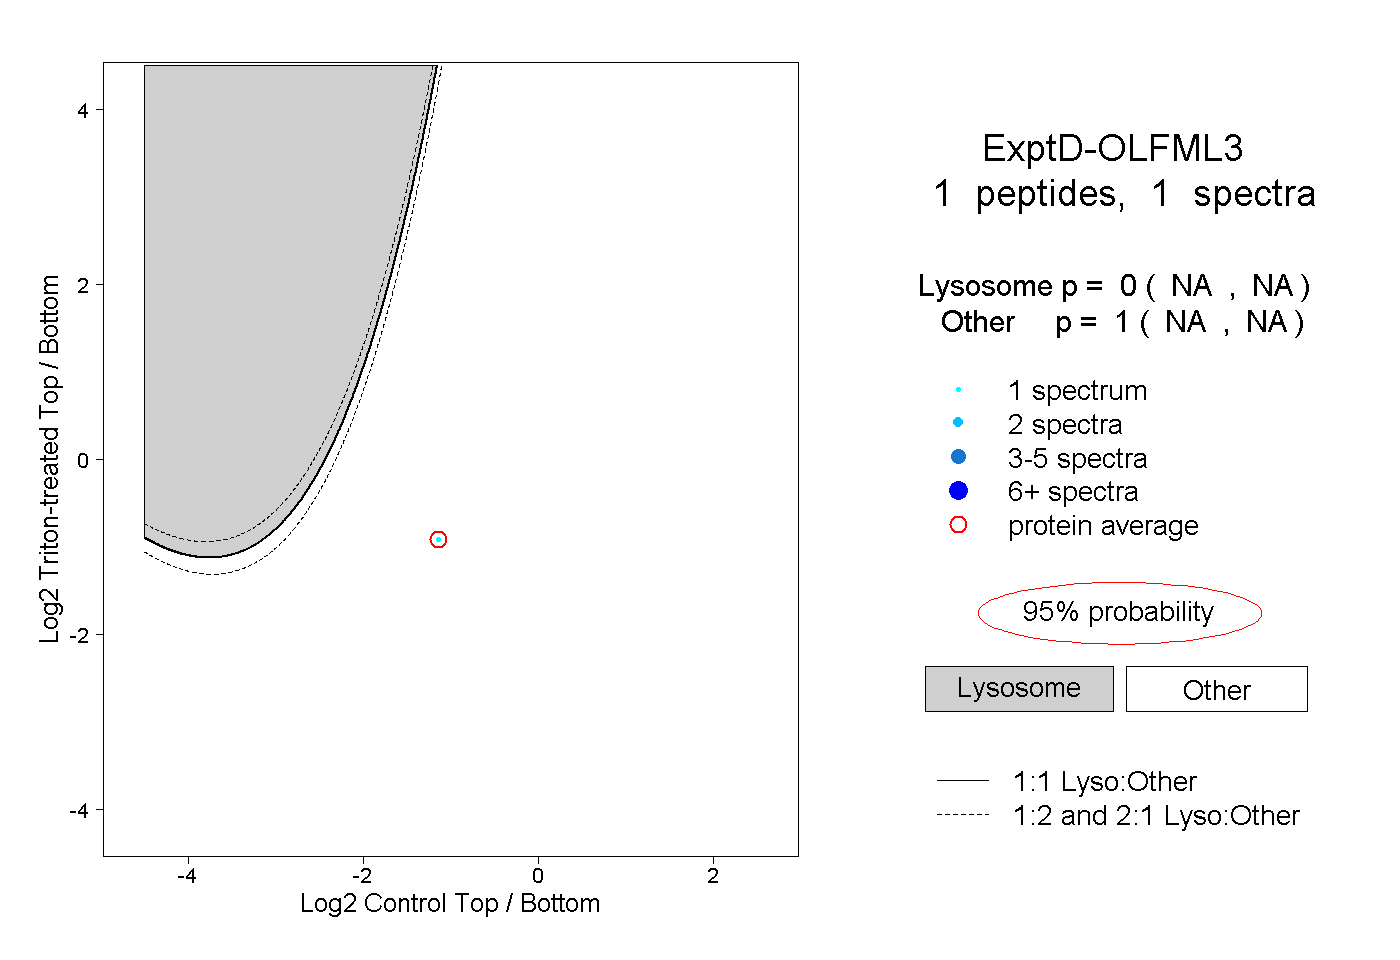
NA | NA
NA | NA