23
23peptides
spectra
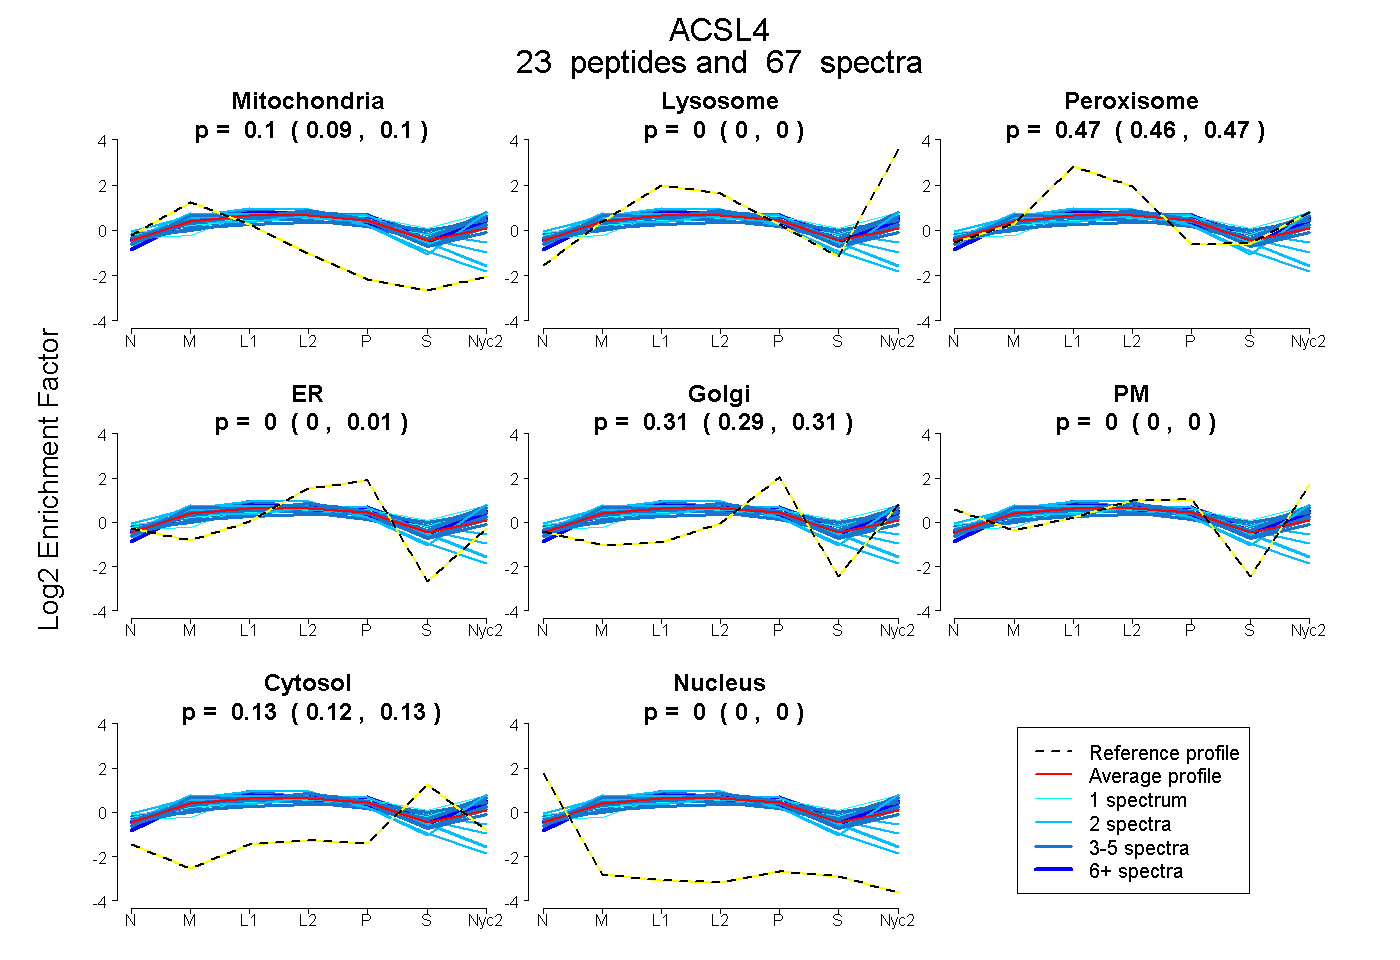
0.091 | 0.099
0.000 | 0.000
0.465 | 0.474
0.000 | 0.013
0.293 | 0.311
0.000 | 0.000
0.123 | 0.129
0.000 | 0.000
15peptides
spectra
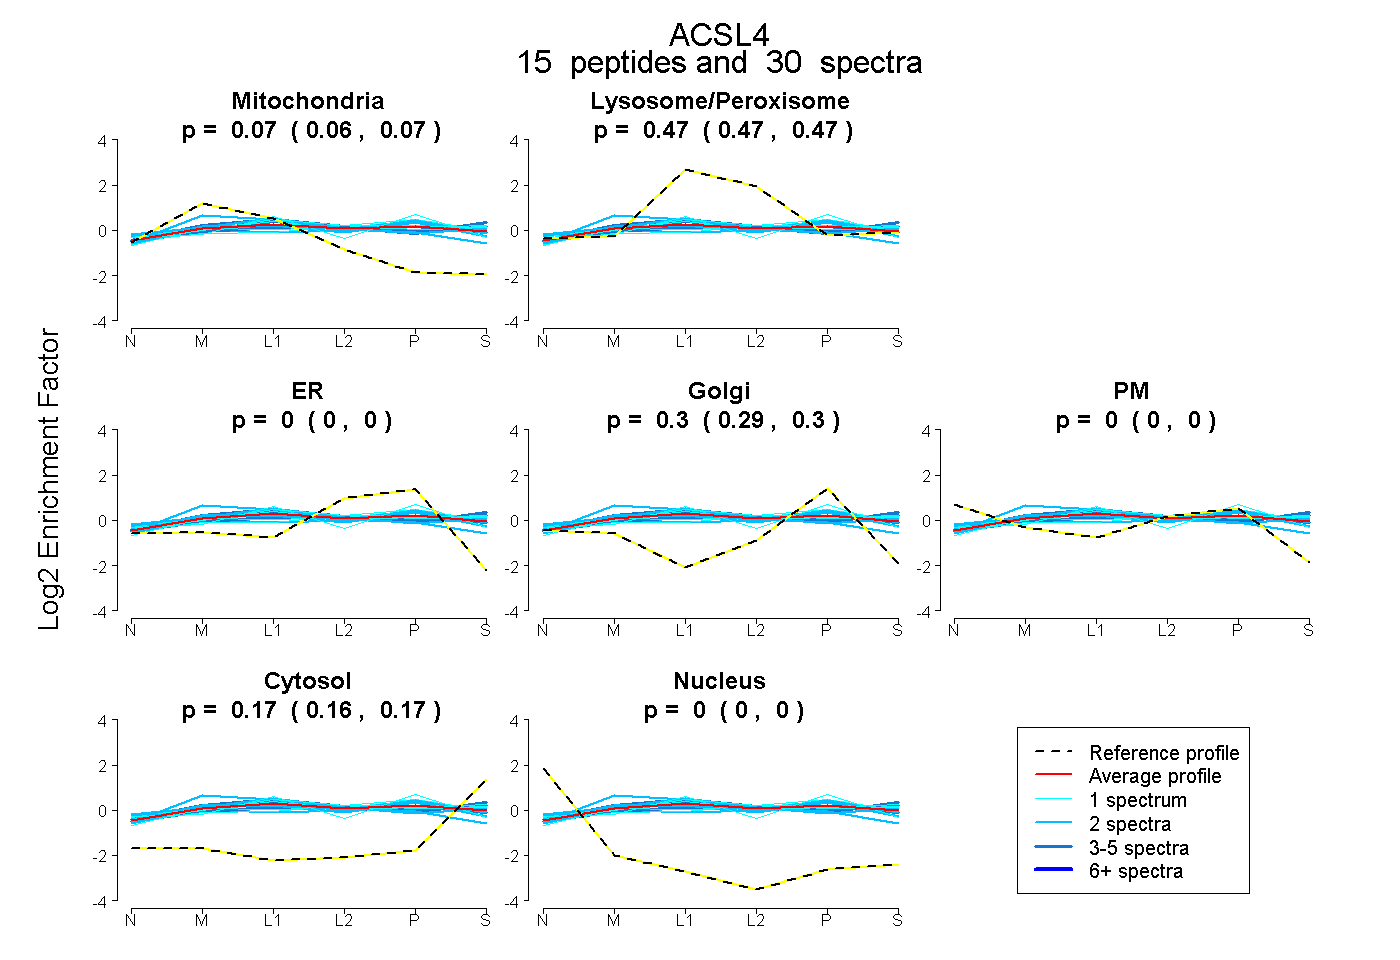
0.059 | 0.070
0.466 | 0.474
0.000 | 0.000
0.292 | 0.302
0.000 | 0.000
0.162 | 0.171
0.000 | 0.000