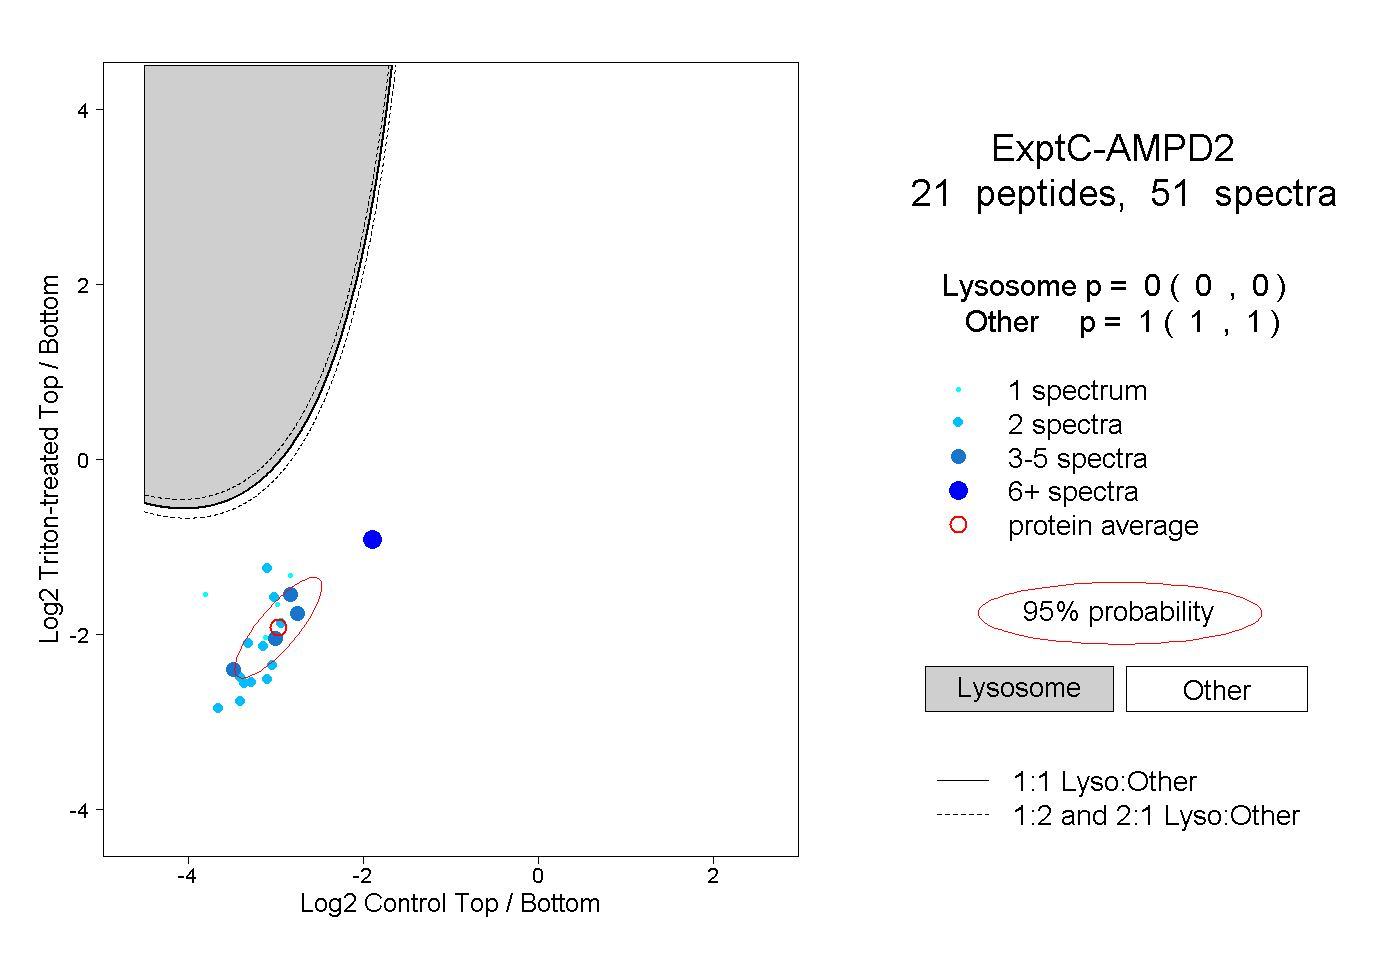
20
20peptides
spectra
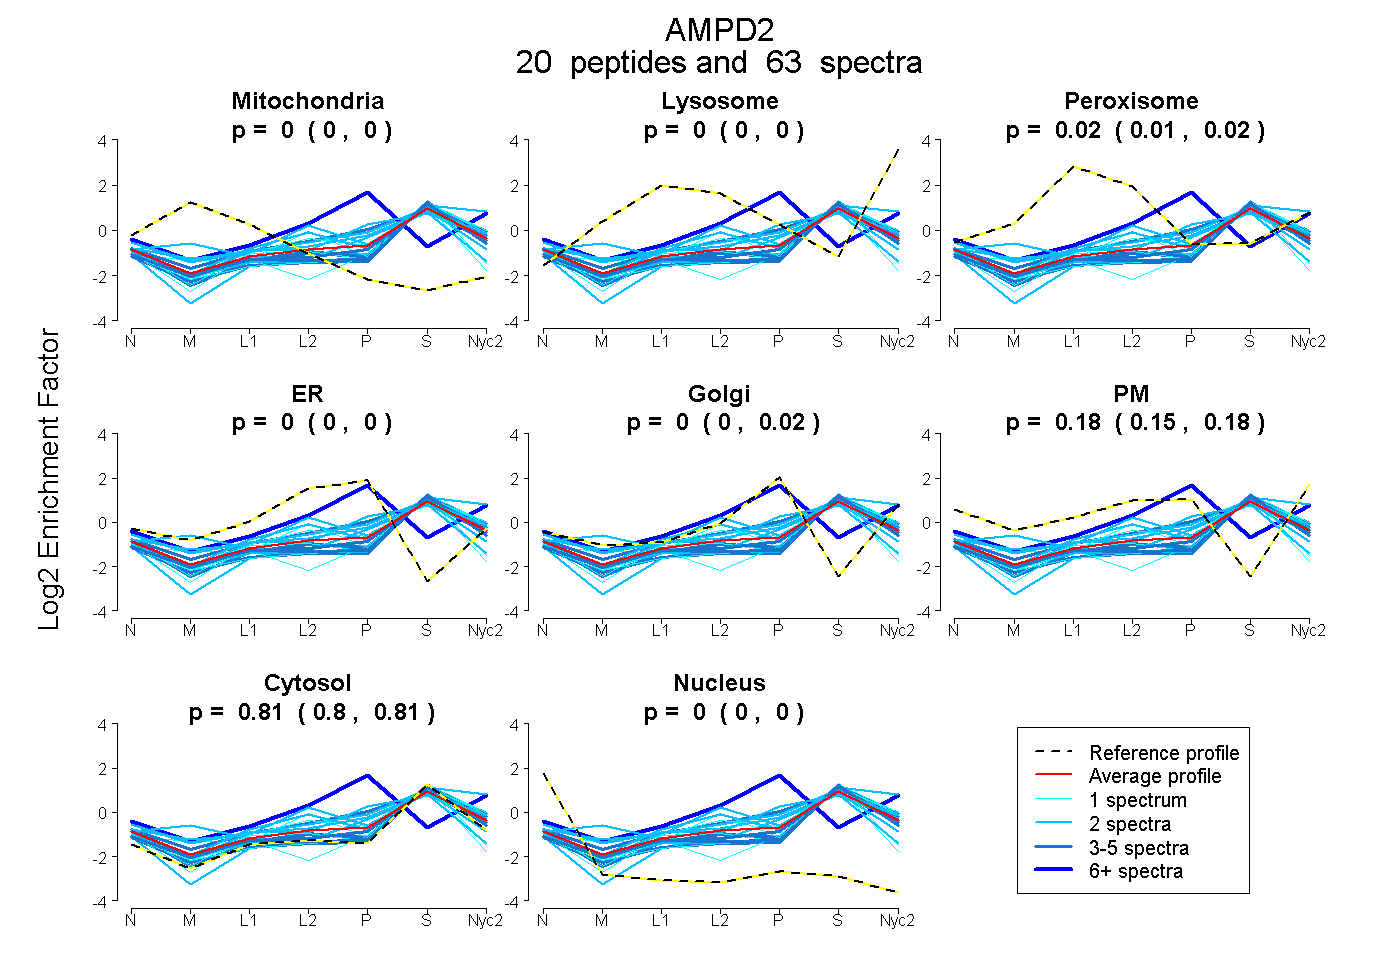
0.000 | 0.000
0.000 | 0.000
0.010 | 0.023
0.000 | 0.000
0.000 | 0.019
0.154 | 0.181
0.800 | 0.812
0.000 | 0.000
11peptides
spectra
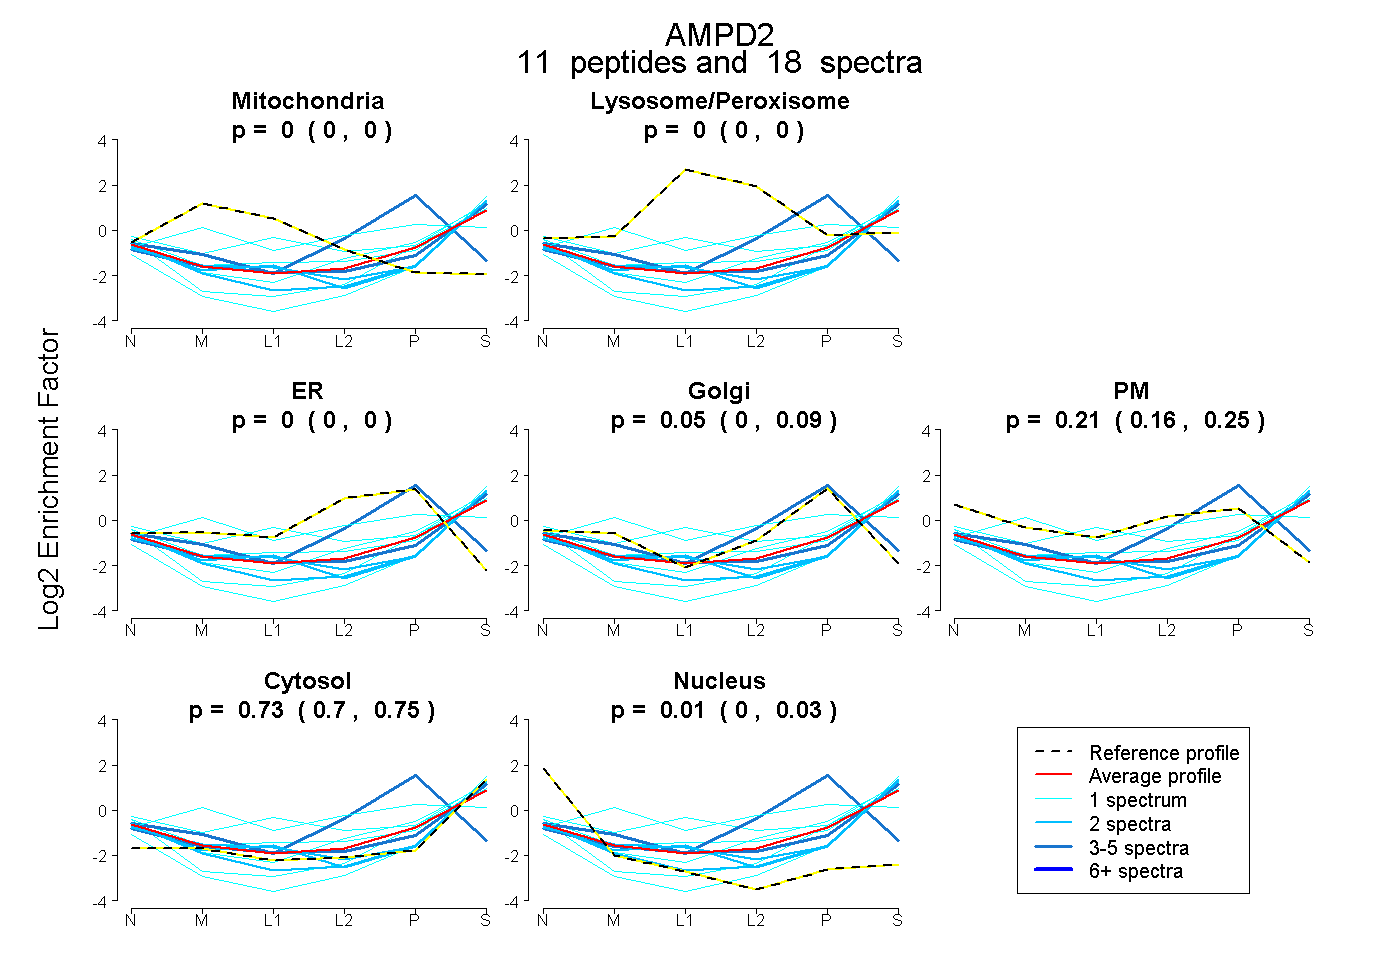
0.000 | 0.000
0.000 | 0.000
0.000 | 0.000
0.000 | 0.094
0.163 | 0.250
0.705 | 0.749
0.000 | 0.028