 3
3peptides
spectra
0.000 | 0.070
0.075 | 0.285
0.000 | 0.120
0.000 | 0.009
0.000 | 0.124
0.105 | 0.403
0.373 | 0.509
0.000 | 0.000
1peptide
spectrum
NA | NA
NA | NA
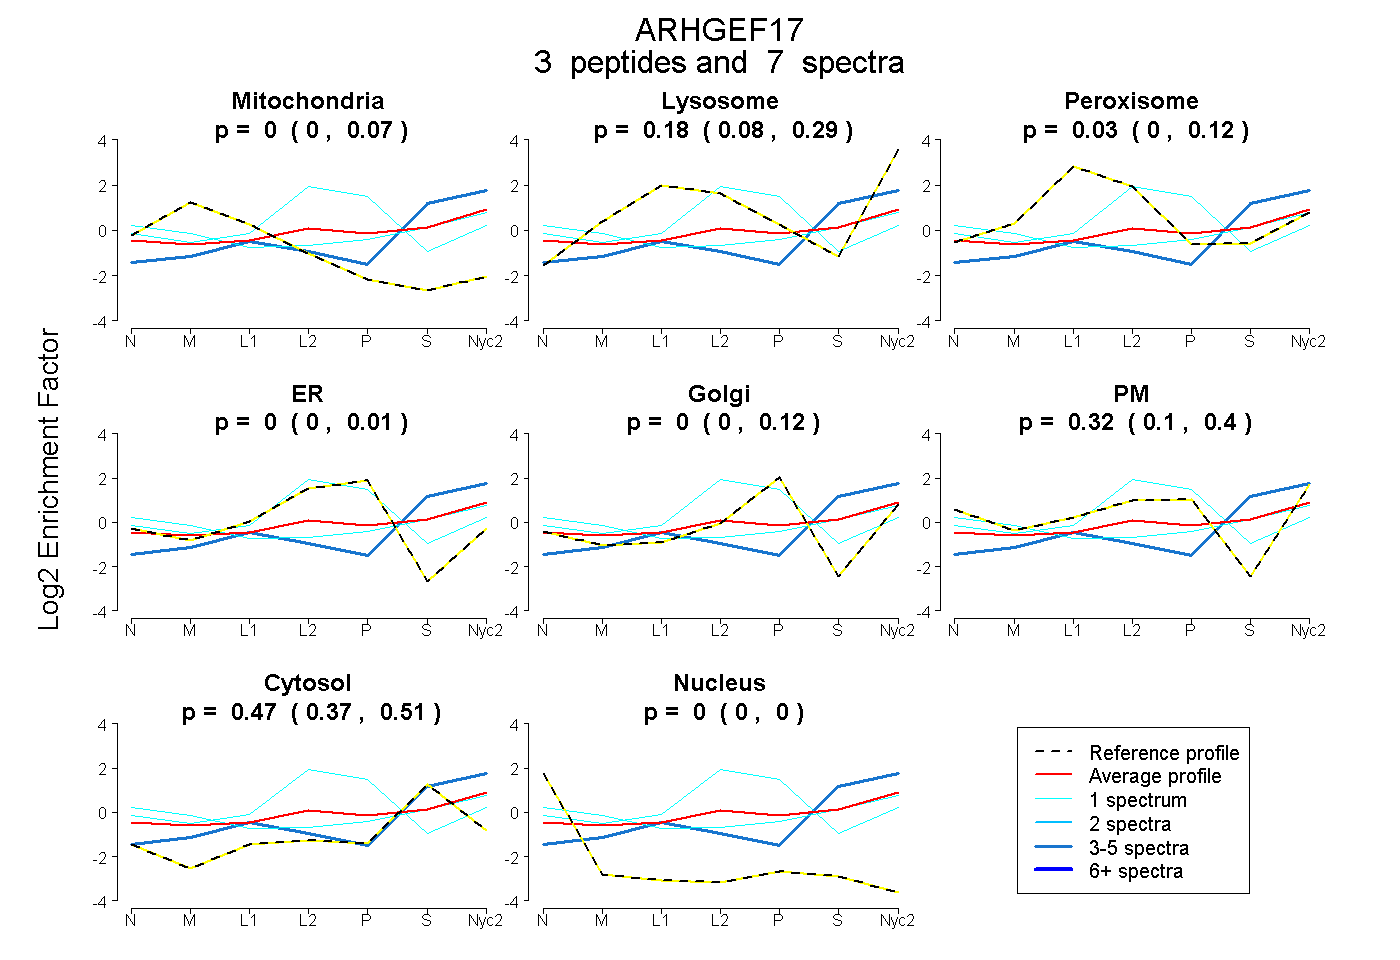
| Plot | Mito | Lyso | Perox | ER | Golgi | PM | Cytosol | Nucleus | |||||
| Expt A |
3 peptides |
7 spectra |
|
0.000 0.000 | 0.070 |
0.184 0.075 | 0.285 |
0.033 0.000 | 0.120 |
0.000 0.000 | 0.009 |
0.000 0.000 | 0.124 |
0.318 0.105 | 0.403 |
0.465 0.373 | 0.509 |
0.000 0.000 | 0.000 |
||
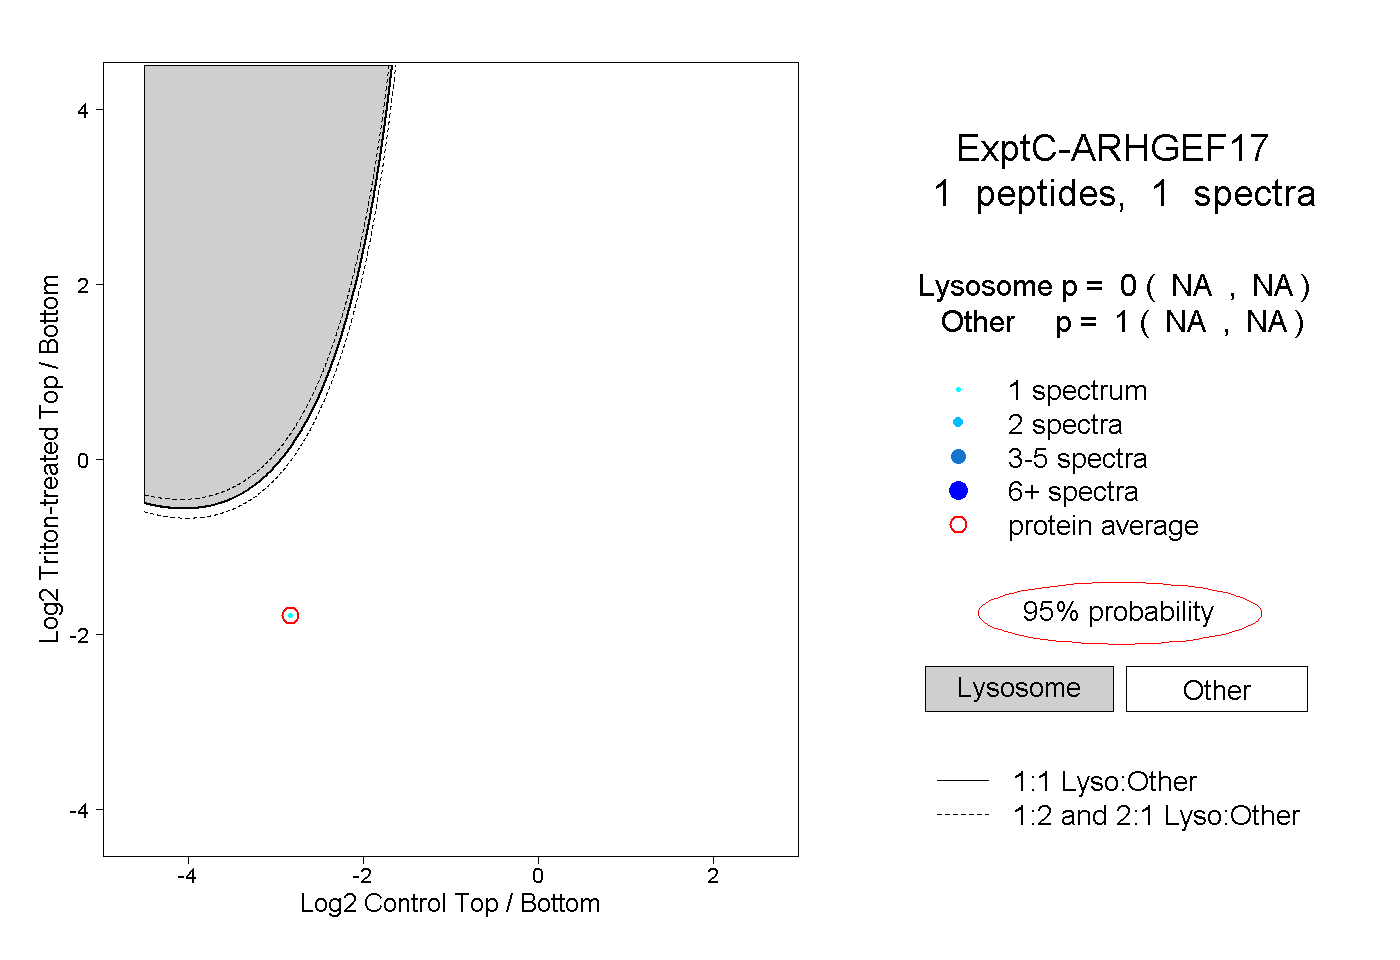
| Plot | Lyso | Other | |||||||||||
| Expt C |
1 peptide |
1 spectrum |
|
0.000 NA | NA |
1.000 NA | NA |