 1
1peptide
spectra
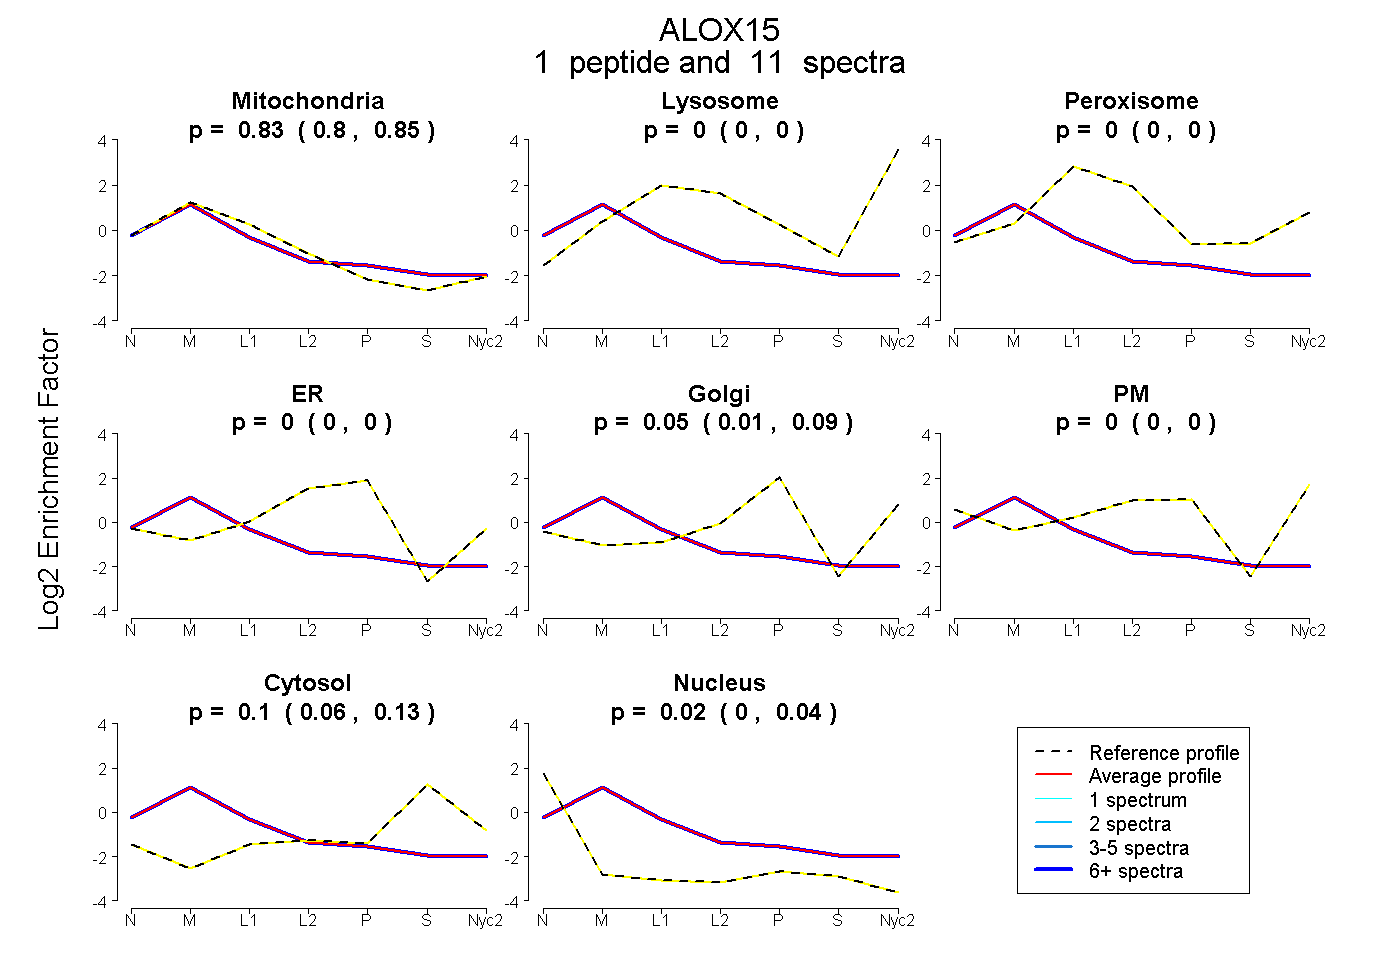
0.802 | 0.850
0.000 | 0.000
0.000 | 0.000
0.000 | 0.000
0.008 | 0.088
0.000 | 0.000
0.060 | 0.126
0.002 | 0.040
1peptide
spectrum
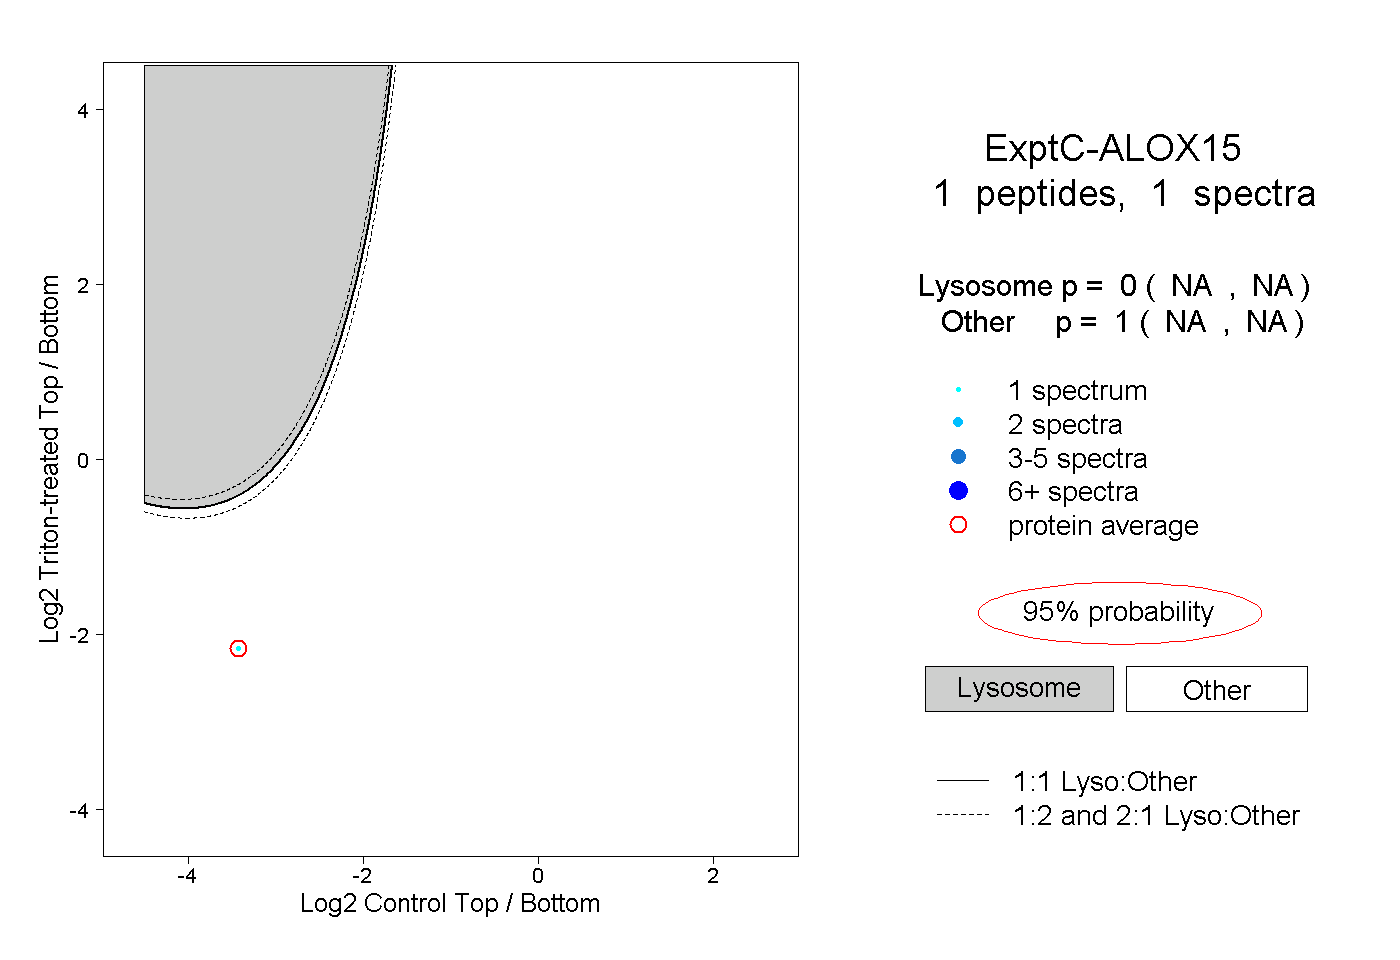
NA | NA
NA | NA
1peptide
spectra
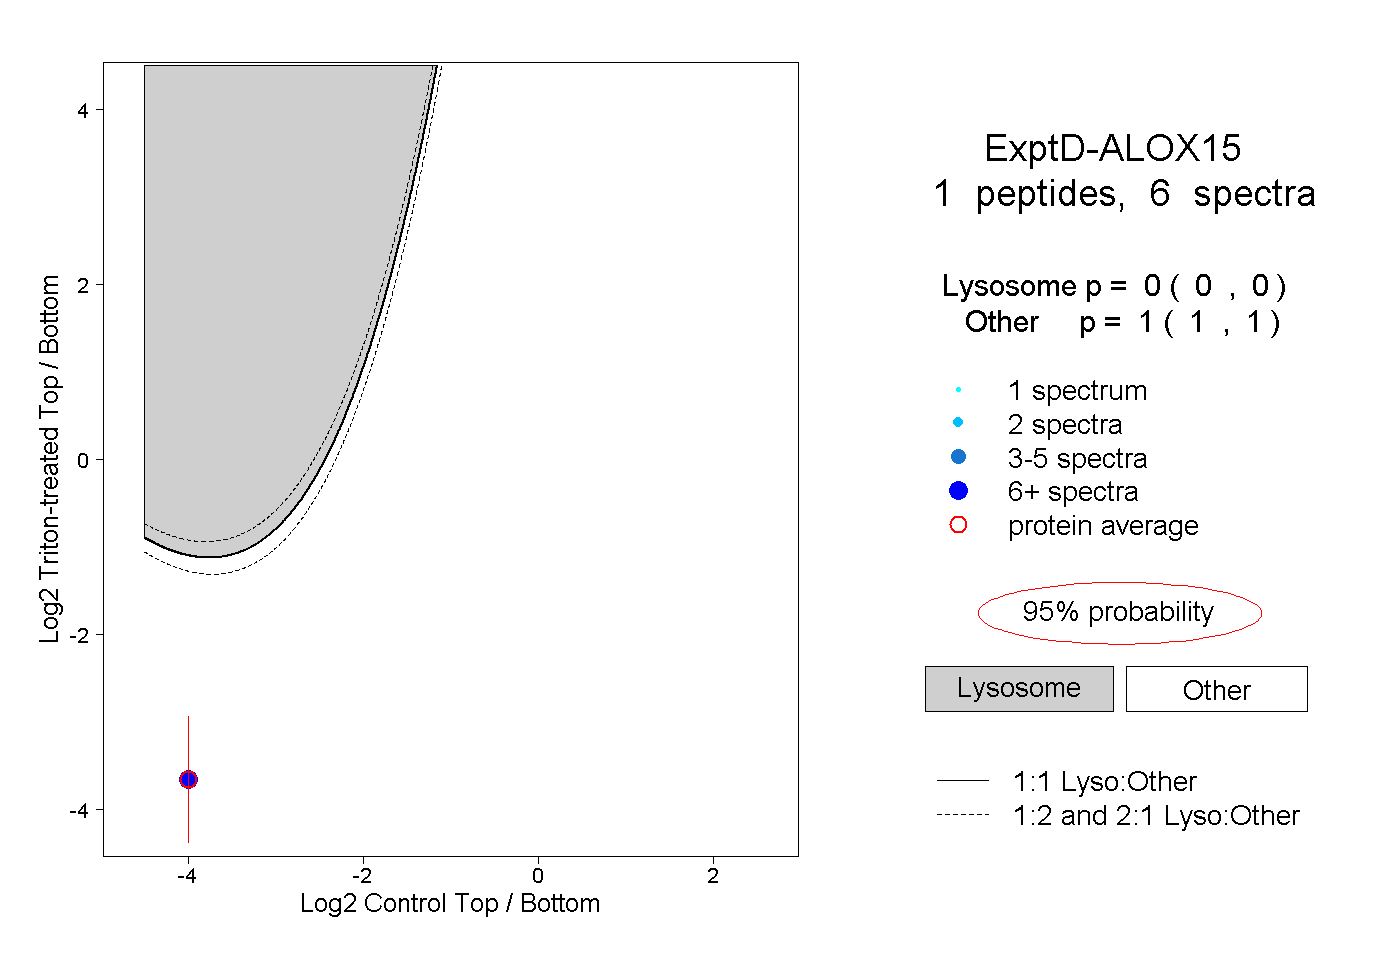
0.000 | 0.000
1.000 | 1.000