 10
10peptides
spectra
0.000 | 0.000
0.000 | 0.000
0.000 | 0.000
0.000 | 0.163
0.024 | 0.174
0.000 | 0.065
0.451 | 0.484
0.293 | 0.334
1peptide
spectra
0.000 | 0.000
1.000 | 1.000
| Plot | Mito | Lyso | Perox | ER | Golgi | PM | Cytosol | Nucleus | |||||
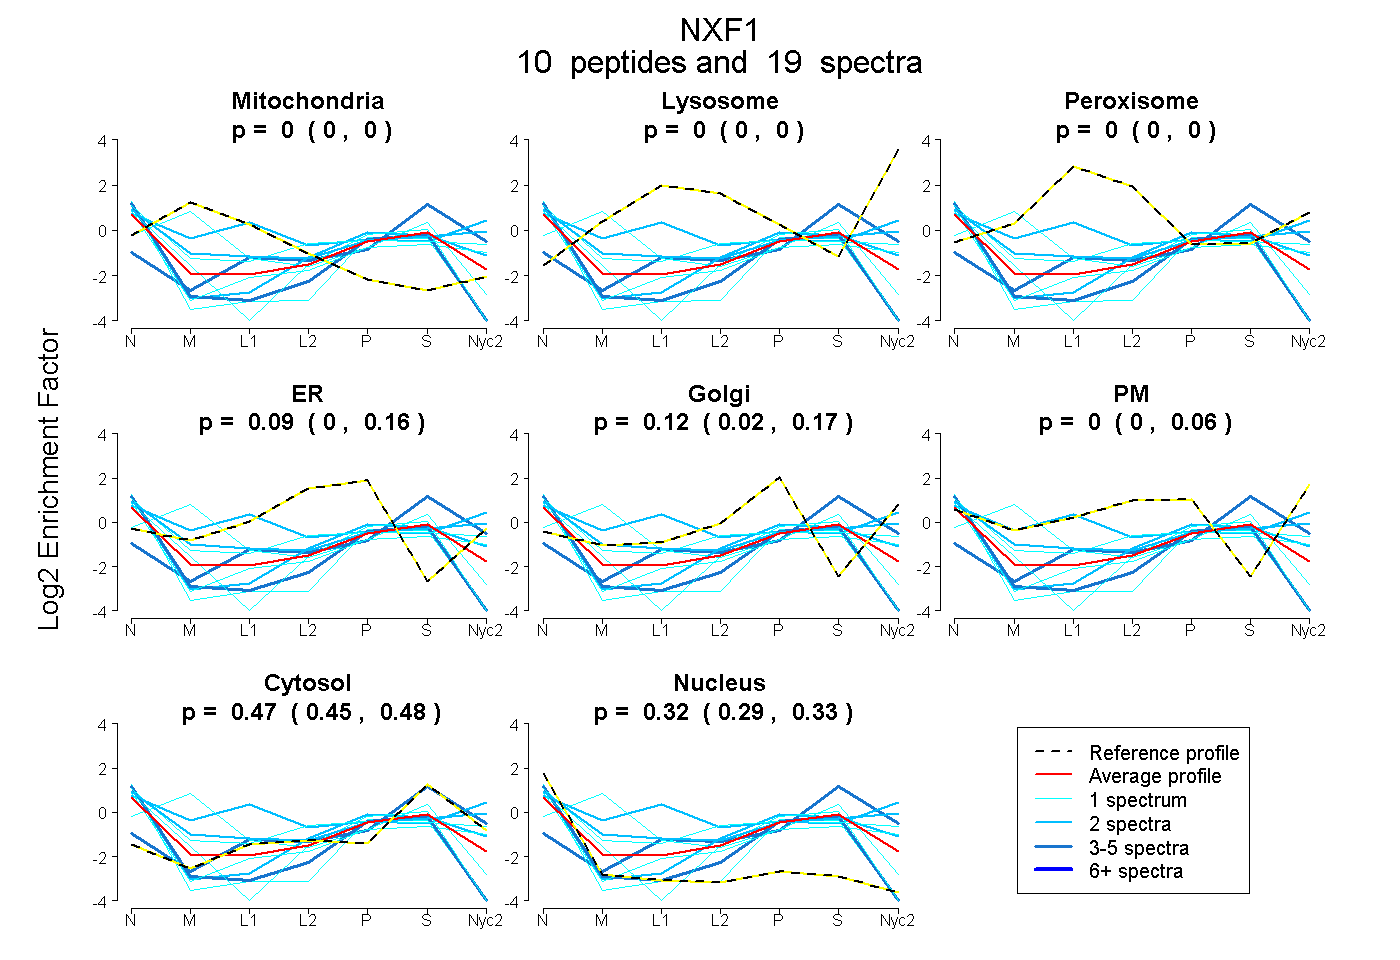
| Expt A |
10 peptides |
19 spectra |
|
0.000 0.000 | 0.000 |
0.000 0.000 | 0.000 |
0.000 0.000 | 0.000 |
0.094 0.000 | 0.163 |
0.118 0.024 | 0.174 |
0.003 0.000 | 0.065 |
0.469 0.451 | 0.484 |
0.315 0.293 | 0.334 |
||
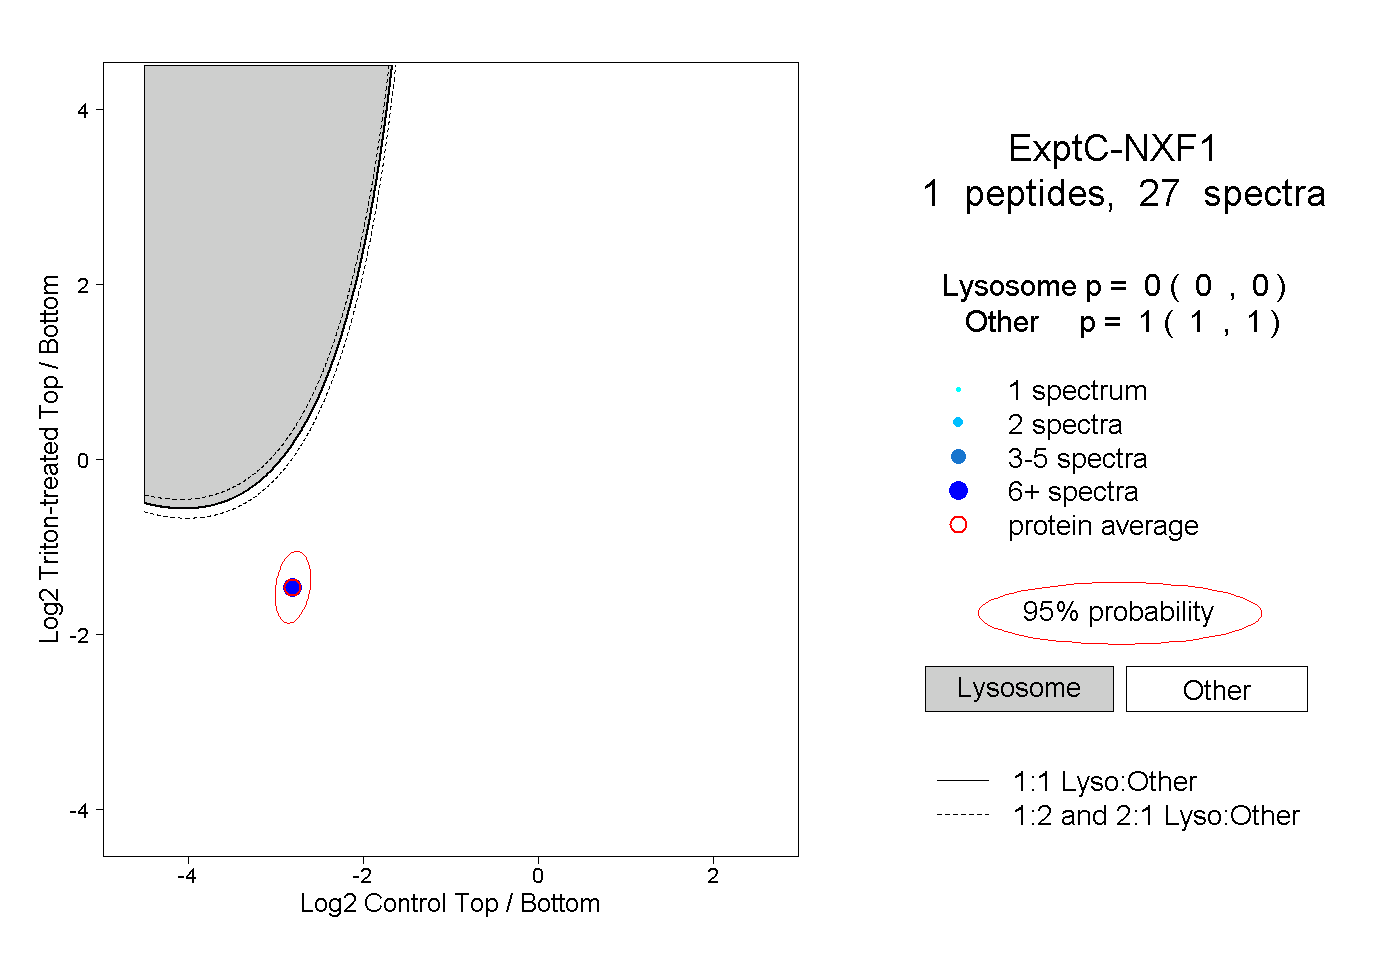
| Plot | Lyso | Other | |||||||||||
| Expt C |
1 peptide |
27 spectra |
|
0.000 0.000 | 0.000 |
1.000 1.000 | 1.000 |