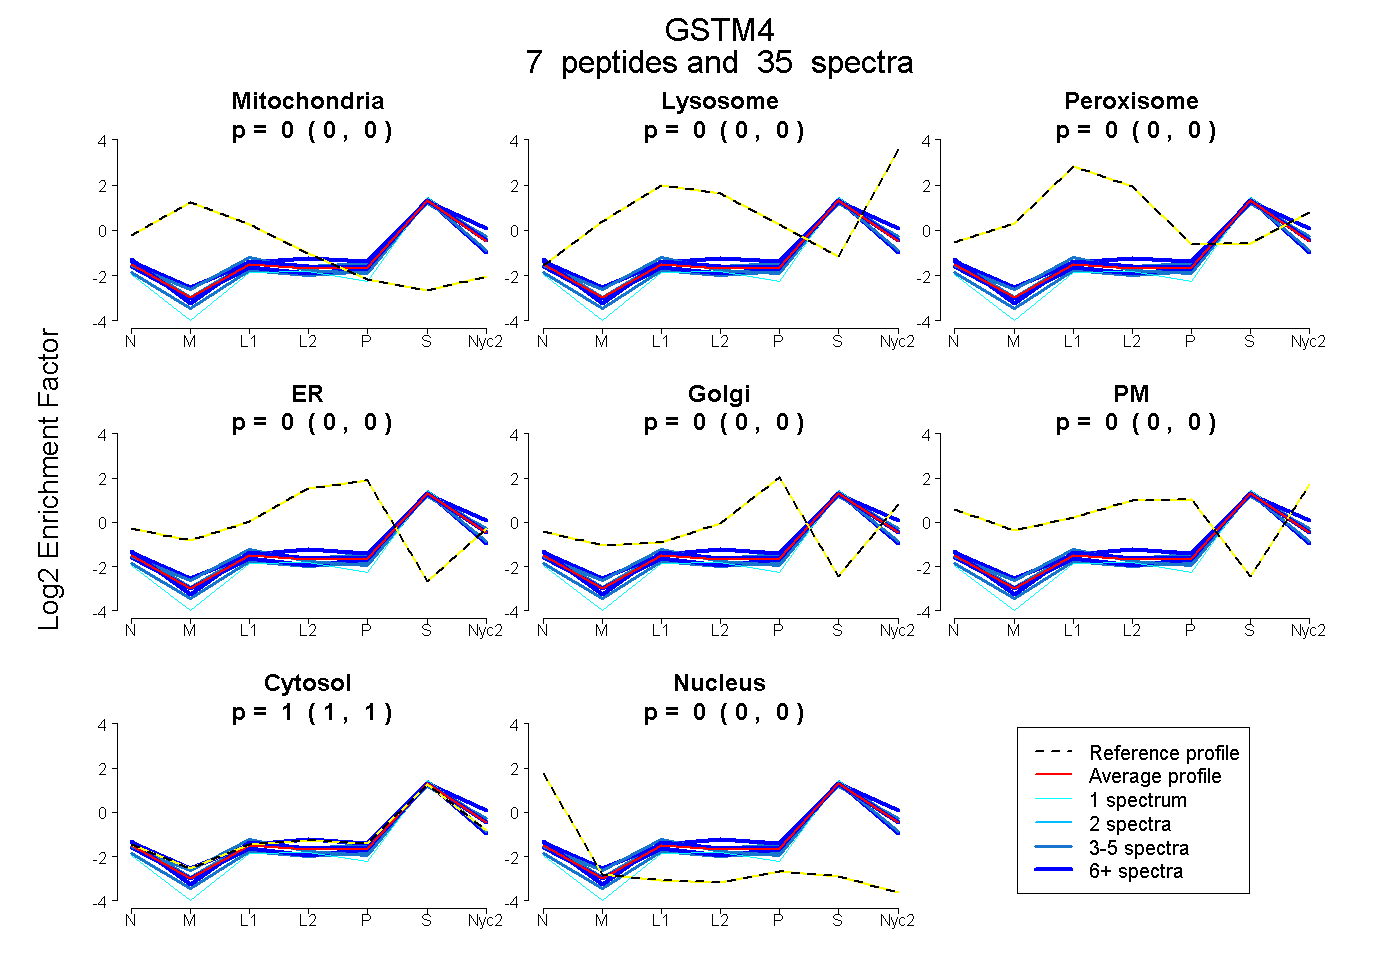
 7
7peptides
spectra
0.000 | 0.000
0.000 | 0.000
0.000 | 0.000
0.000 | 0.000
0.000 | 0.000
0.000 | 0.000
1.000 | 1.000
0.000 | 0.000
| Plot | Mito | Lyso | Perox | ER | Golgi | PM | Cytosol | Nucleus | |||||
| Expt A |
7 peptides |
35 spectra |
|
0.000 0.000 | 0.000 |
0.000 0.000 | 0.000 |
0.000 0.000 | 0.000 |
0.000 0.000 | 0.000 |
0.000 0.000 | 0.000 |
0.000 0.000 | 0.000 |
1.000 1.000 | 1.000 |
0.000 0.000 | 0.000 |
| 3 spectra, ISVYMK | 0.000 | 0.000 | 0.000 | 0.000 | 0.000 | 0.000 | 1.000 | 0.000 | ||
| 7 spectra, VATWGNK | 0.000 | 0.073 | 0.000 | 0.000 | 0.000 | 0.000 | 0.927 | 0.000 | ||
| 8 spectra, YTMGDAPDYDR | 0.000 | 0.000 | 0.000 | 0.000 | 0.000 | 0.000 | 0.998 | 0.002 | ||
| 10 spectra, TPLYTR | 0.000 | 0.000 | 0.000 | 0.000 | 0.000 | 0.000 | 0.967 | 0.033 | ||
| 1 spectrum, VDILENQAMDVSNQLAR | 0.000 | 0.000 | 0.000 | 0.000 | 0.000 | 0.000 | 1.000 | 0.000 | ||
| 3 spectra, QTWFVGEK | 0.000 | 0.008 | 0.000 | 0.000 | 0.000 | 0.000 | 0.992 | 0.000 | ||
| 3 spectra, VCYSPDFENLK | 0.000 | 0.000 | 0.000 | 0.000 | 0.000 | 0.000 | 0.983 | 0.017 |
| Plot | Mito | Lyso or Perox | ER | Golgi | PM | Cytosol | Nucleus | ||||||
| Expt B |
2 peptides |
5 spectra |
 |
0.000 0.000 | 0.000 |
0.000 0.000 | 0.000 |
0.000 0.000 | 0.000 |
0.000 0.000 | 0.000 |
0.000 0.000 | 0.000 |
1.000 0.972 | 1.000 |
0.000 0.000 | 0.023 |
|||
| Plot | Lyso | Other | |||||||||||
| Expt C |
6 peptides |
28 spectra |
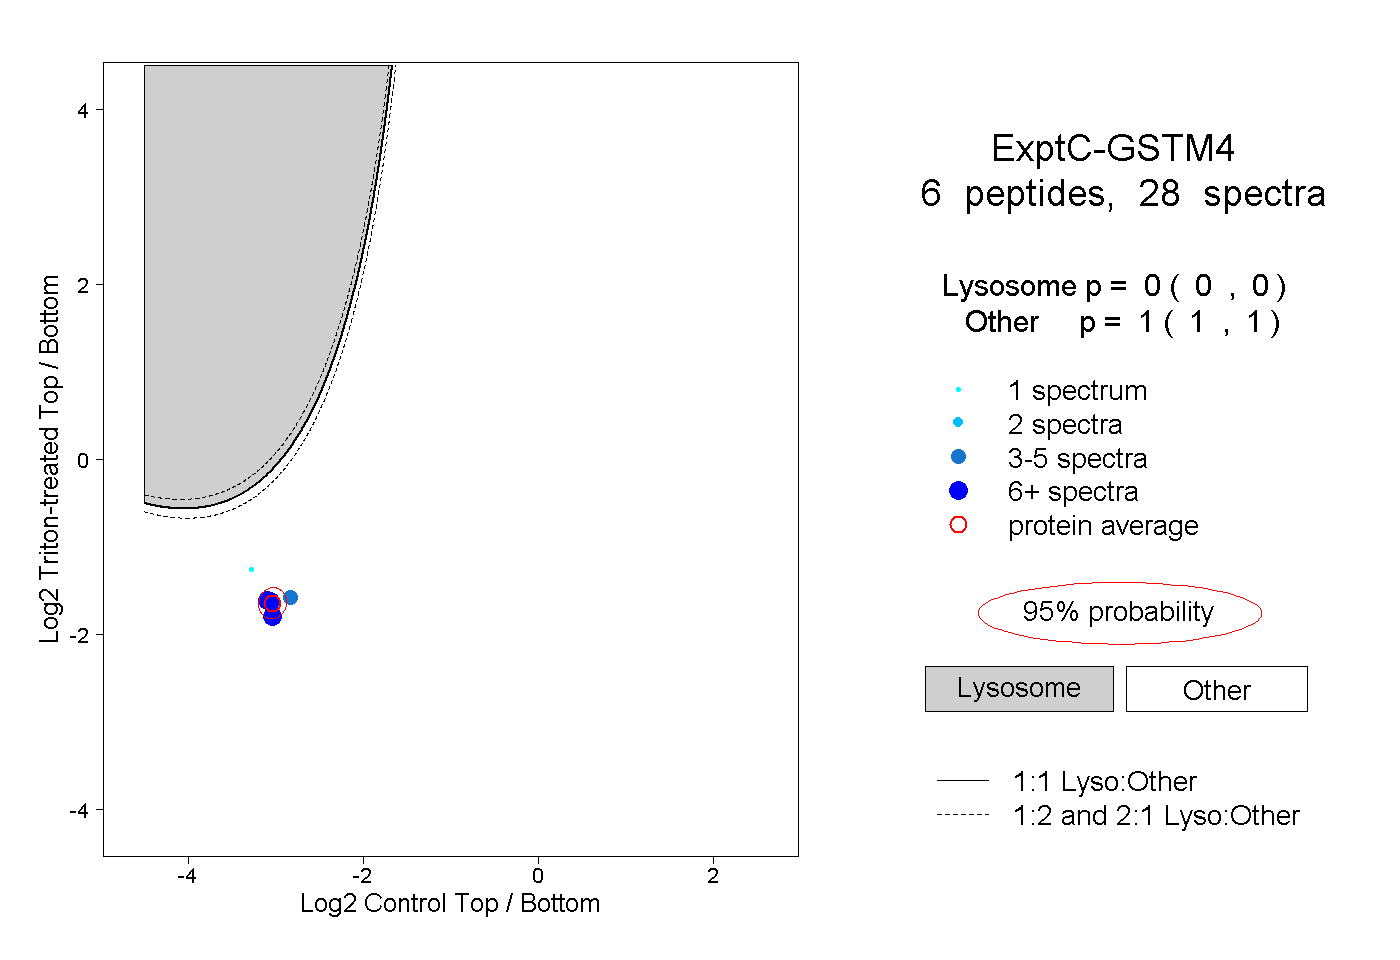 |
0.000 0.000 | 0.000 |
1.000 1.000 | 1.000 |
||||||||
| Plot | Lyso | Other | |||||||||||
| Expt D |
1 peptide |
2 spectra |
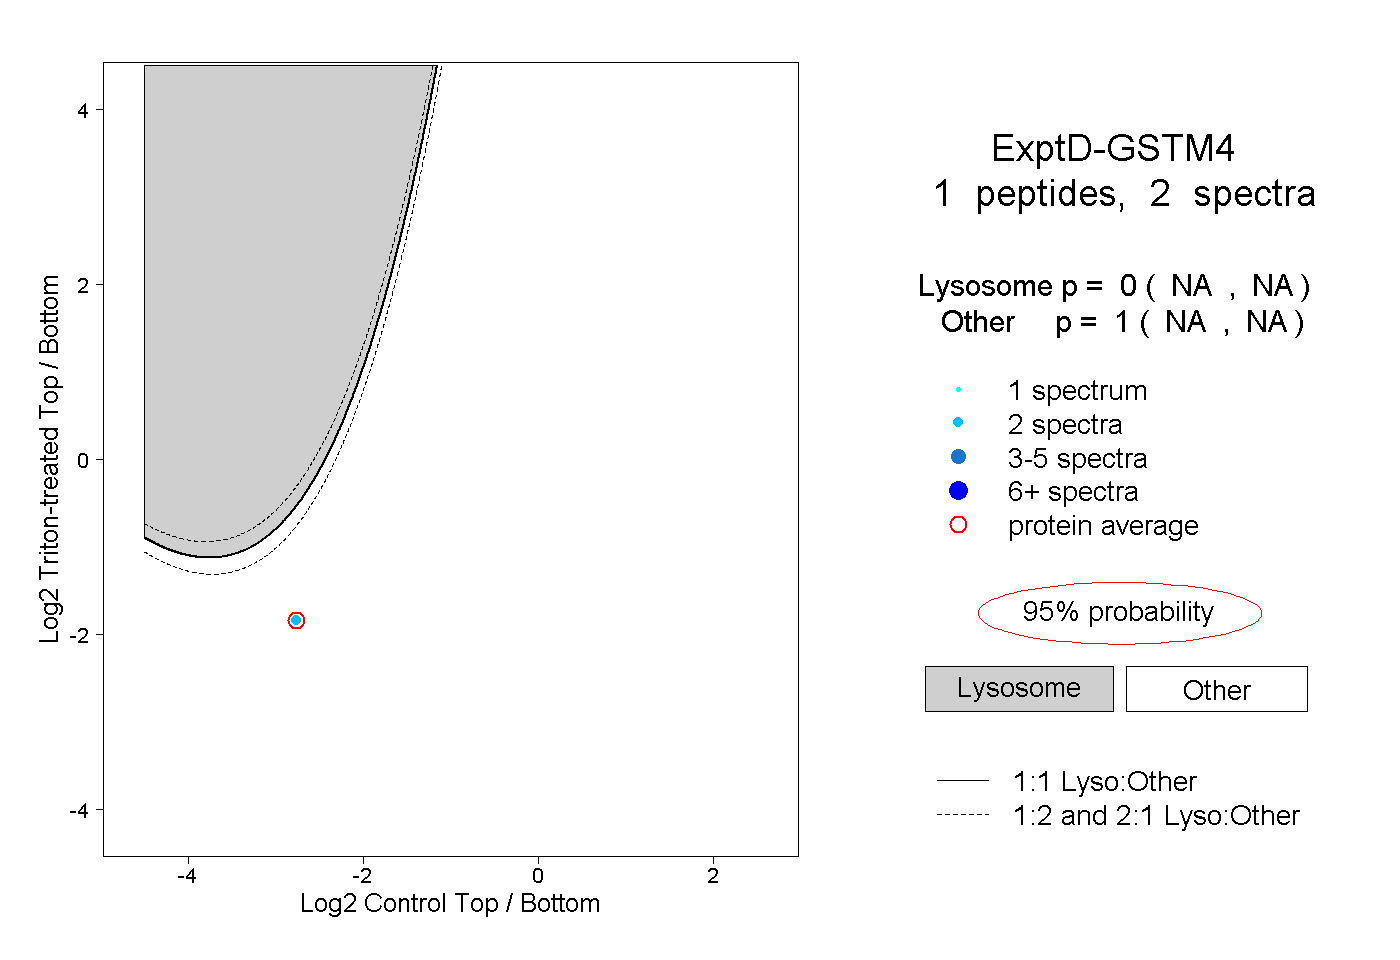 |
0.000 NA | NA |
1.000 NA | NA |