 2
2peptides
spectra

0.000 | 0.000
0.260 | 0.342
0.000 | 0.000
0.000 | 0.000
0.000 | 0.000
0.393 | 0.484
0.227 | 0.273
0.000 | 0.000
| Plot | Mito | Lyso | Perox | ER | Golgi | PM | Cytosol | Nucleus | |||||
| Expt A |
2 peptides |
4 spectra |
|
0.000 0.000 | 0.000 |
0.304 0.260 | 0.342 |
0.000 0.000 | 0.000 |
0.000 0.000 | 0.000 |
0.000 0.000 | 0.000 |
0.444 0.393 | 0.484 |
0.252 0.227 | 0.273 |
0.000 0.000 | 0.000 |
| 2 spectra, VRPAIEYALR | 0.000 | 0.374 | 0.000 | 0.000 | 0.000 | 0.334 | 0.292 | 0.000 | ||
| 2 spectra, IMLAVHR | 0.000 | 0.234 | 0.000 | 0.000 | 0.000 | 0.554 | 0.212 | 0.000 |
| Plot | Lyso | Other | |||||||||||
| Expt C |
4 peptides |
5 spectra |
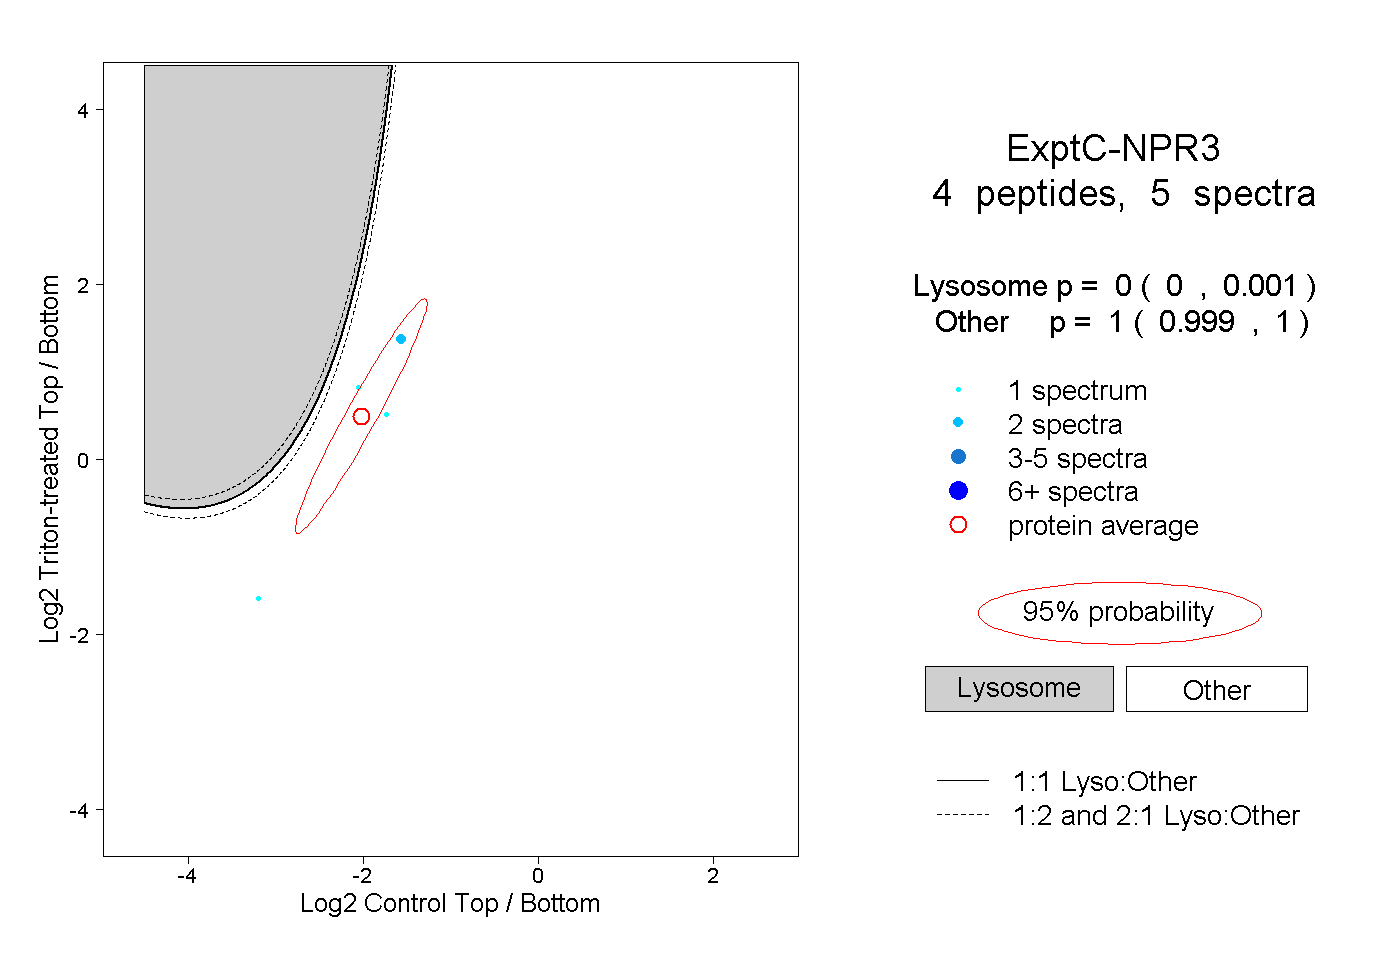 |
0.000 0.000 | 0.001 |
1.000 0.999 | 1.000 |