 5
5peptides
spectra
0.000 | 0.000
0.800 | 0.837
0.000 | 0.000
0.000 | 0.000
0.000 | 0.000
0.000 | 0.016
0.157 | 0.193
0.000 | 0.000
3peptides
spectra
0.000 | 0.000
1.000 | 1.000
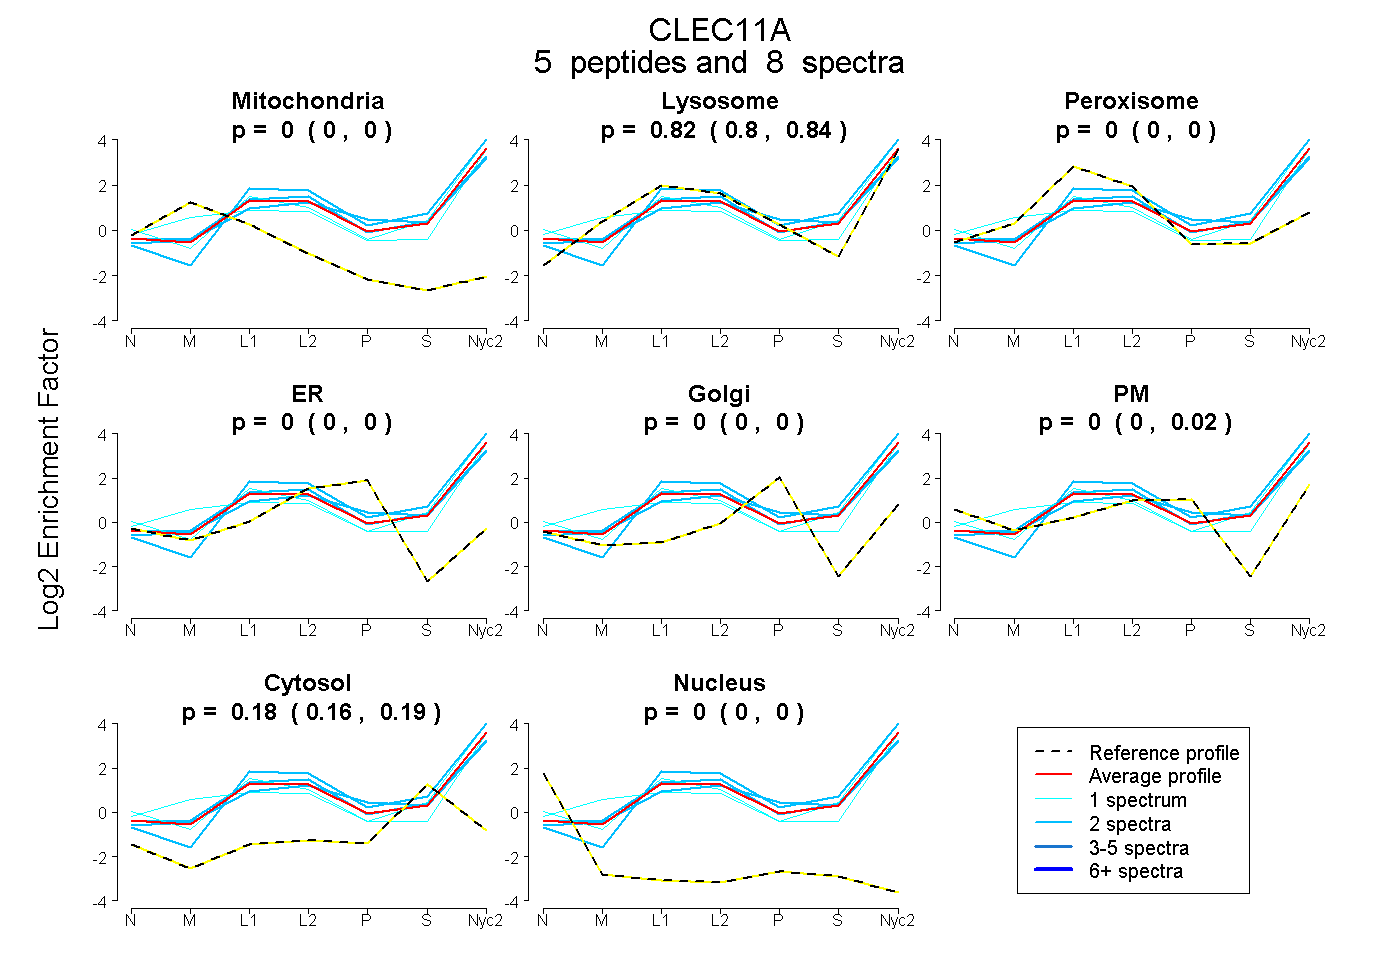
| Plot | Mito | Lyso | Perox | ER | Golgi | PM | Cytosol | Nucleus | |||||
| Expt A |
5 peptides |
8 spectra |
|
0.000 0.000 | 0.000 |
0.823 0.800 | 0.837 |
0.000 0.000 | 0.000 |
0.000 0.000 | 0.000 |
0.000 0.000 | 0.000 |
0.000 0.000 | 0.016 |
0.177 0.157 | 0.193 |
0.000 0.000 | 0.000 |
||
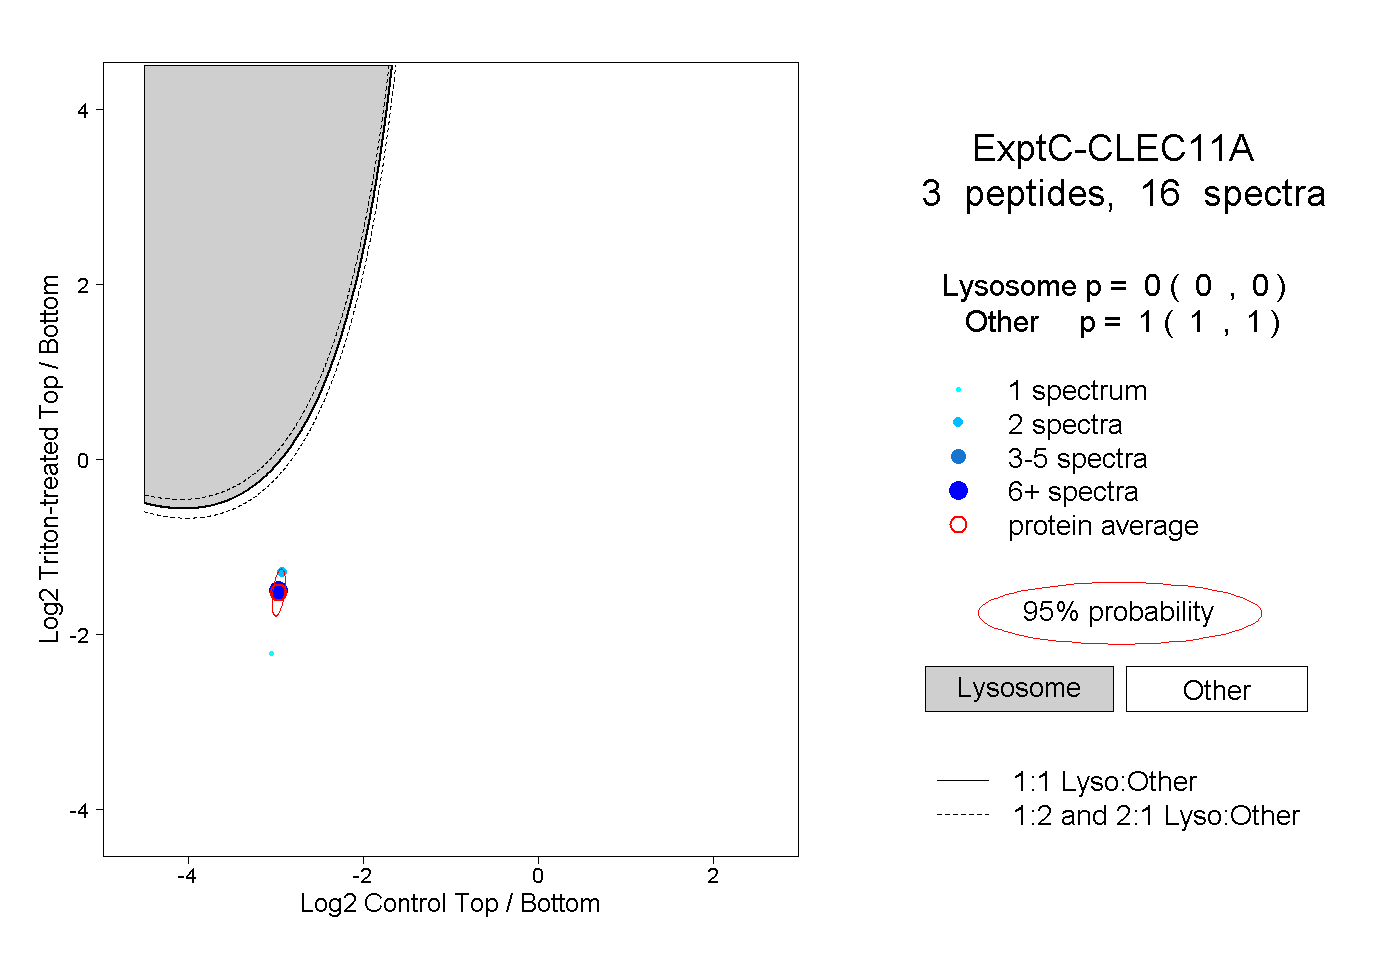
| Plot | Lyso | Other | |||||||||||
| Expt C |
3 peptides |
16 spectra |
|
0.000 0.000 | 0.000 |
1.000 1.000 | 1.000 |