 5
5peptides
spectra
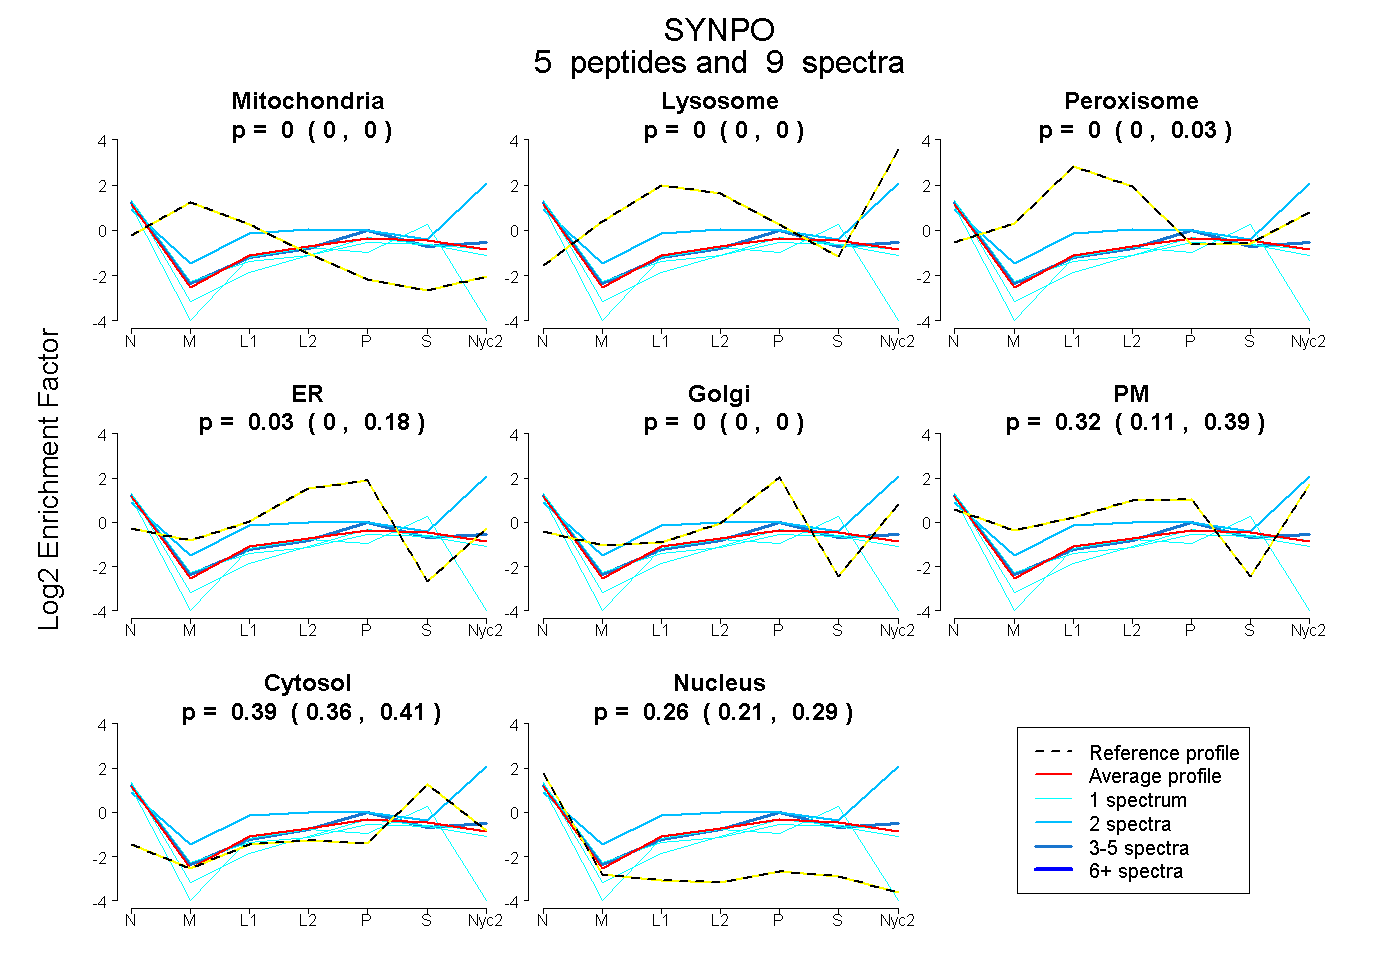
0.000 | 0.000
0.000 | 0.000
0.000 | 0.026
0.000 | 0.175
0.000 | 0.000
0.105 | 0.387
0.362 | 0.413
0.207 | 0.294
| Plot | Mito | Lyso | Perox | ER | Golgi | PM | Cytosol | Nucleus | |||||
| Expt A |
5 peptides |
9 spectra |
|
0.000 0.000 | 0.000 |
0.000 0.000 | 0.000 |
0.000 0.000 | 0.026 |
0.027 0.000 | 0.175 |
0.000 0.000 | 0.000 |
0.323 0.105 | 0.387 |
0.395 0.362 | 0.413 |
0.256 0.207 | 0.294 |
| 4 spectra, AGLPPSPALPRPSR | 0.000 | 0.000 | 0.000 | 0.000 | 0.045 | 0.376 | 0.330 | 0.249 | ||
| 1 spectrum, VSAPPSAASPFSR | 0.000 | 0.000 | 0.000 | 0.000 | 0.000 | 0.316 | 0.348 | 0.336 | ||
| 1 spectrum, VASEEEEVPLVVYLK | 0.000 | 0.000 | 0.000 | 0.077 | 0.000 | 0.000 | 0.482 | 0.441 | ||
| 2 spectra, QAPRPSFSTR | 0.000 | 0.097 | 0.000 | 0.000 | 0.000 | 0.582 | 0.321 | 0.000 | ||
| 1 spectrum, VTPNPDLLDLVQTADEK | 0.000 | 0.000 | 0.000 | 0.000 | 0.118 | 0.187 | 0.366 | 0.329 |