15
15peptides
spectra
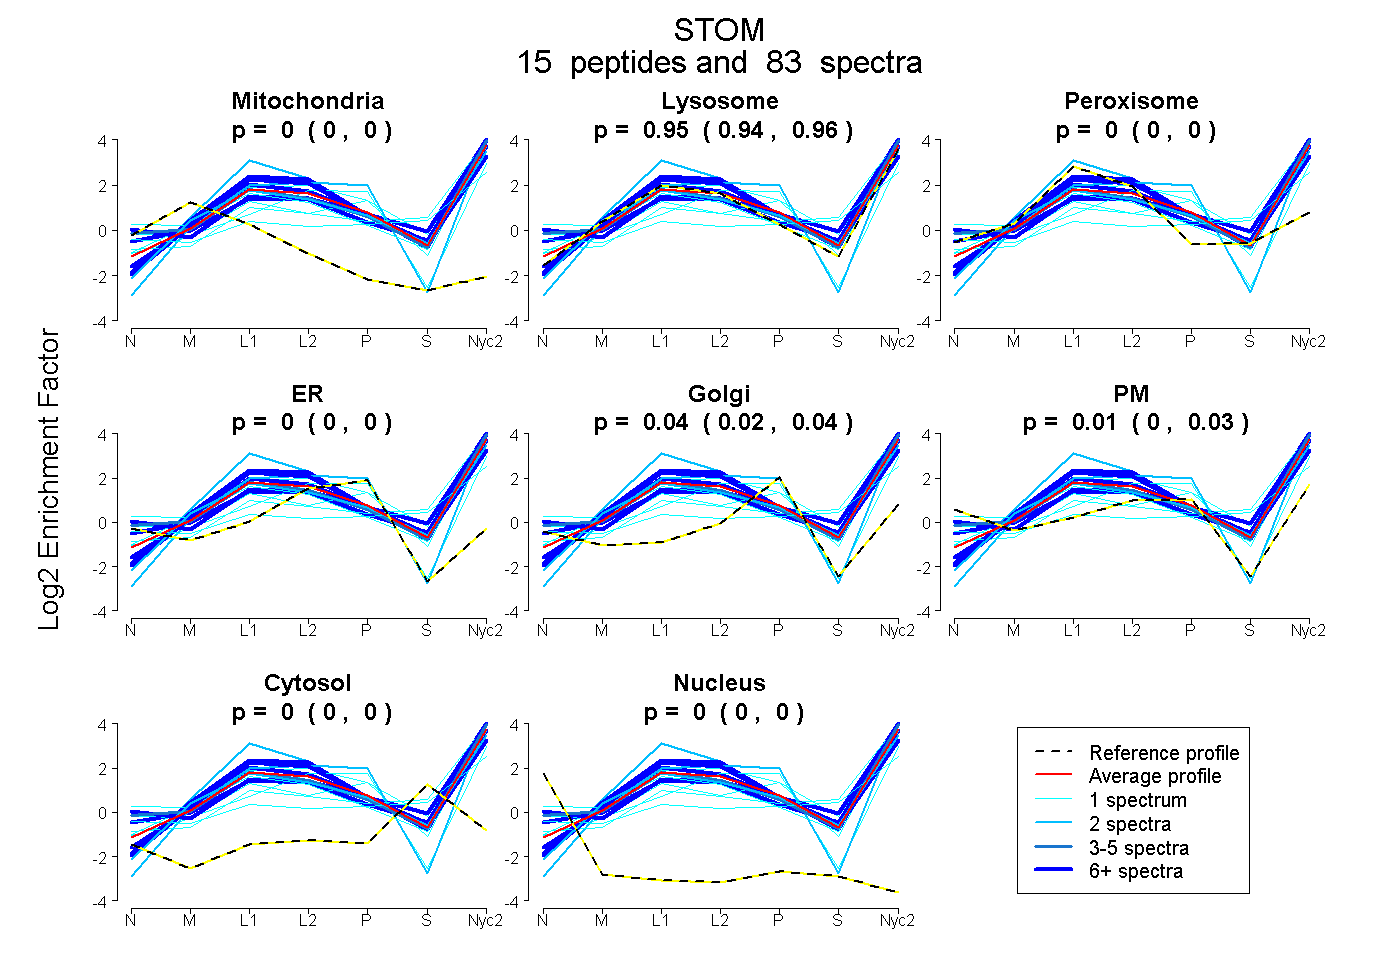
0.000 | 0.000
0.941 | 0.961
0.000 | 0.000
0.000 | 0.000
0.017 | 0.045
0.000 | 0.033
0.000 | 0.003
0.000 | 0.000
6peptides
spectra
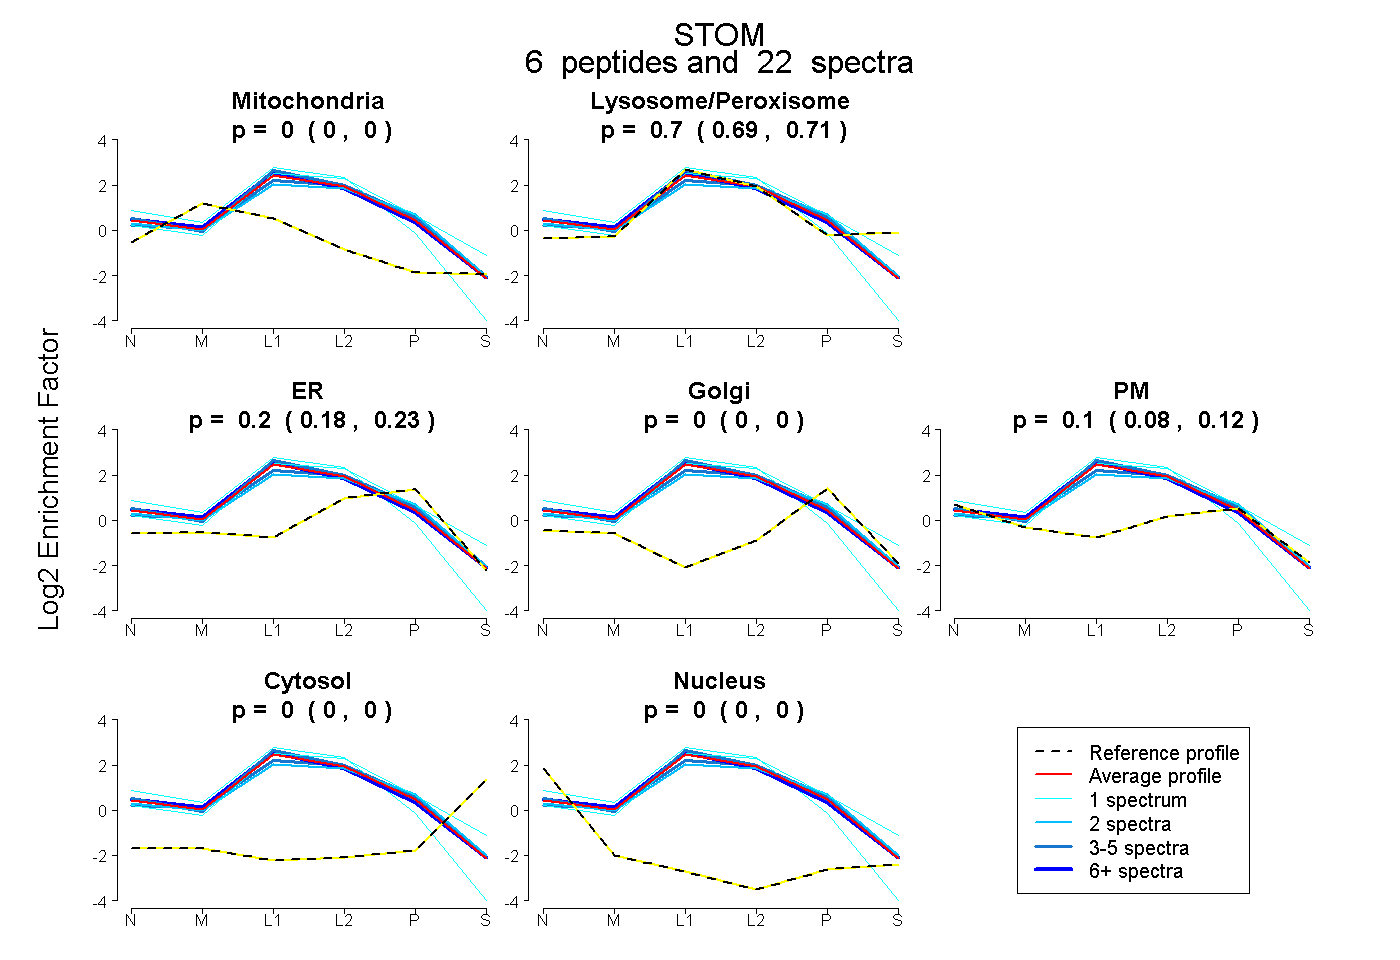
0.000 | 0.000
0.685 | 0.708
0.179 | 0.226
0.000 | 0.000
0.076 | 0.117
0.000 | 0.000
0.000 | 0.000
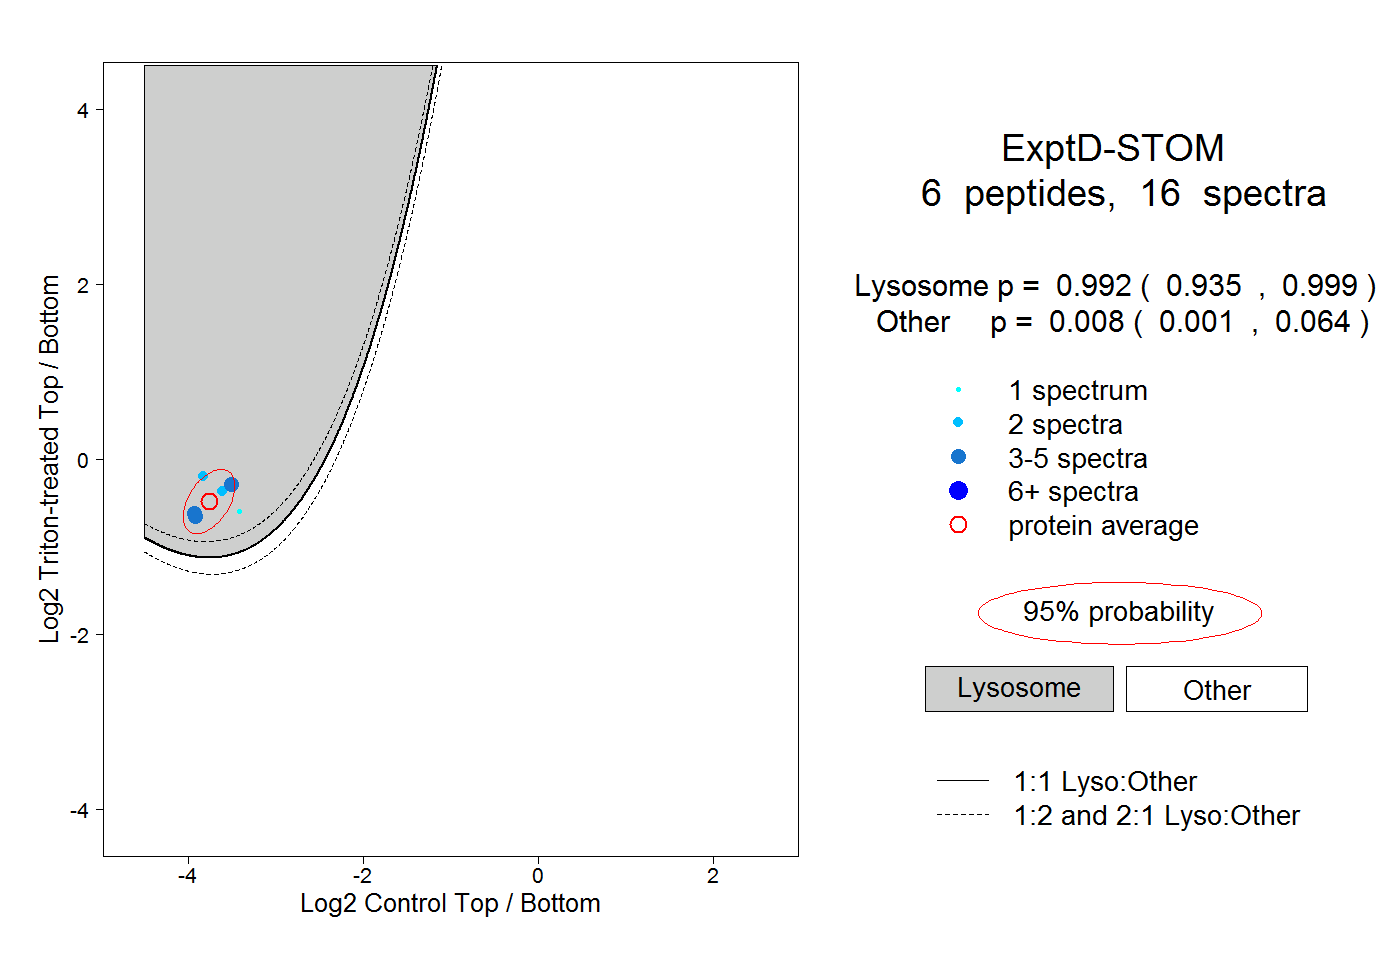
11peptides
spectra
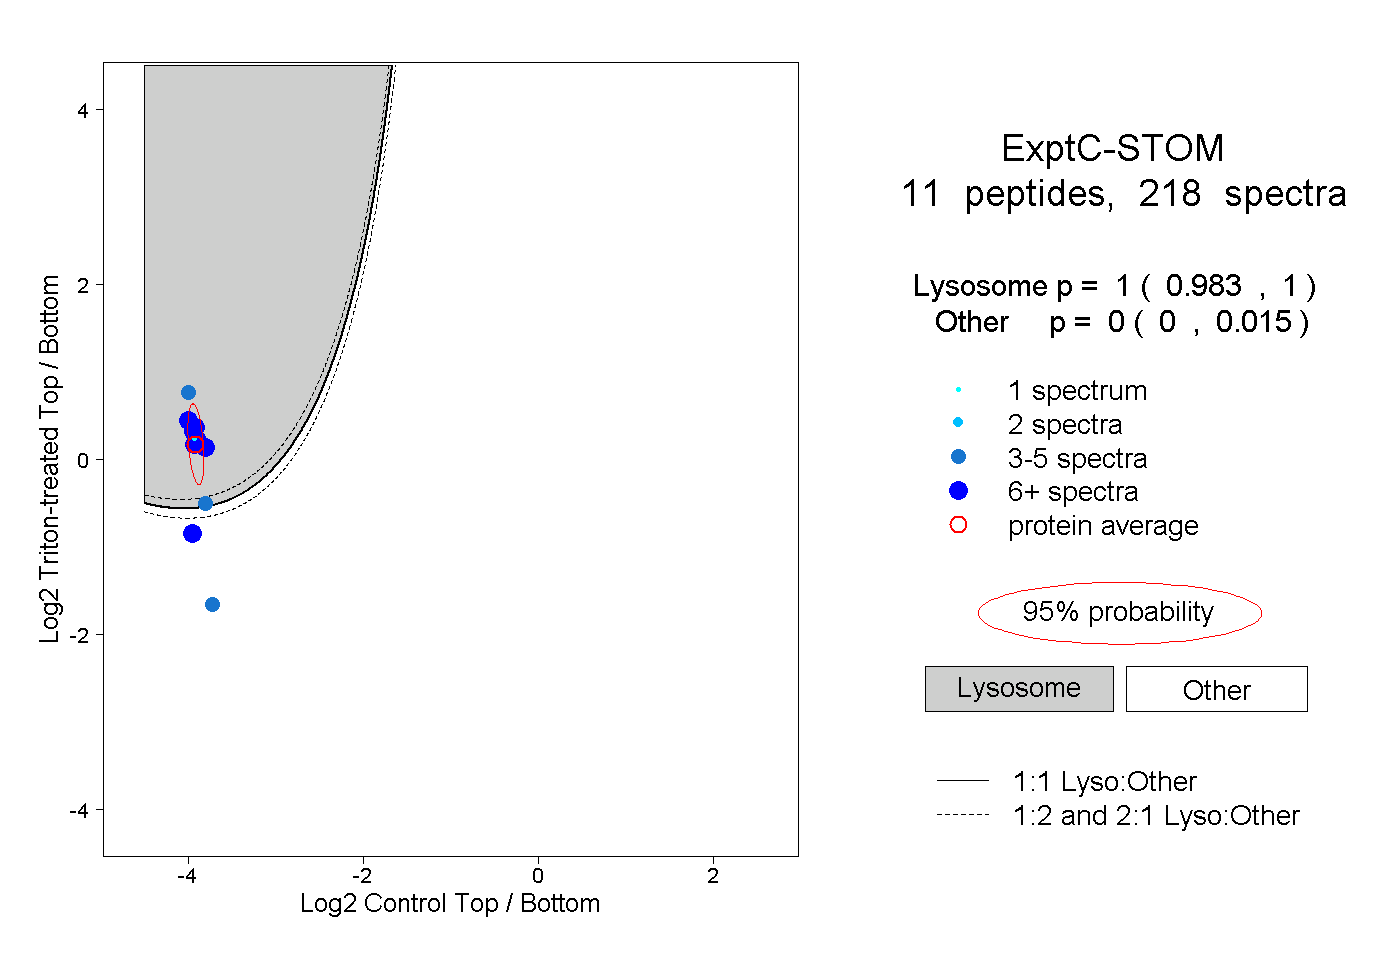
0.983 | 1.000
0.000 | 0.015