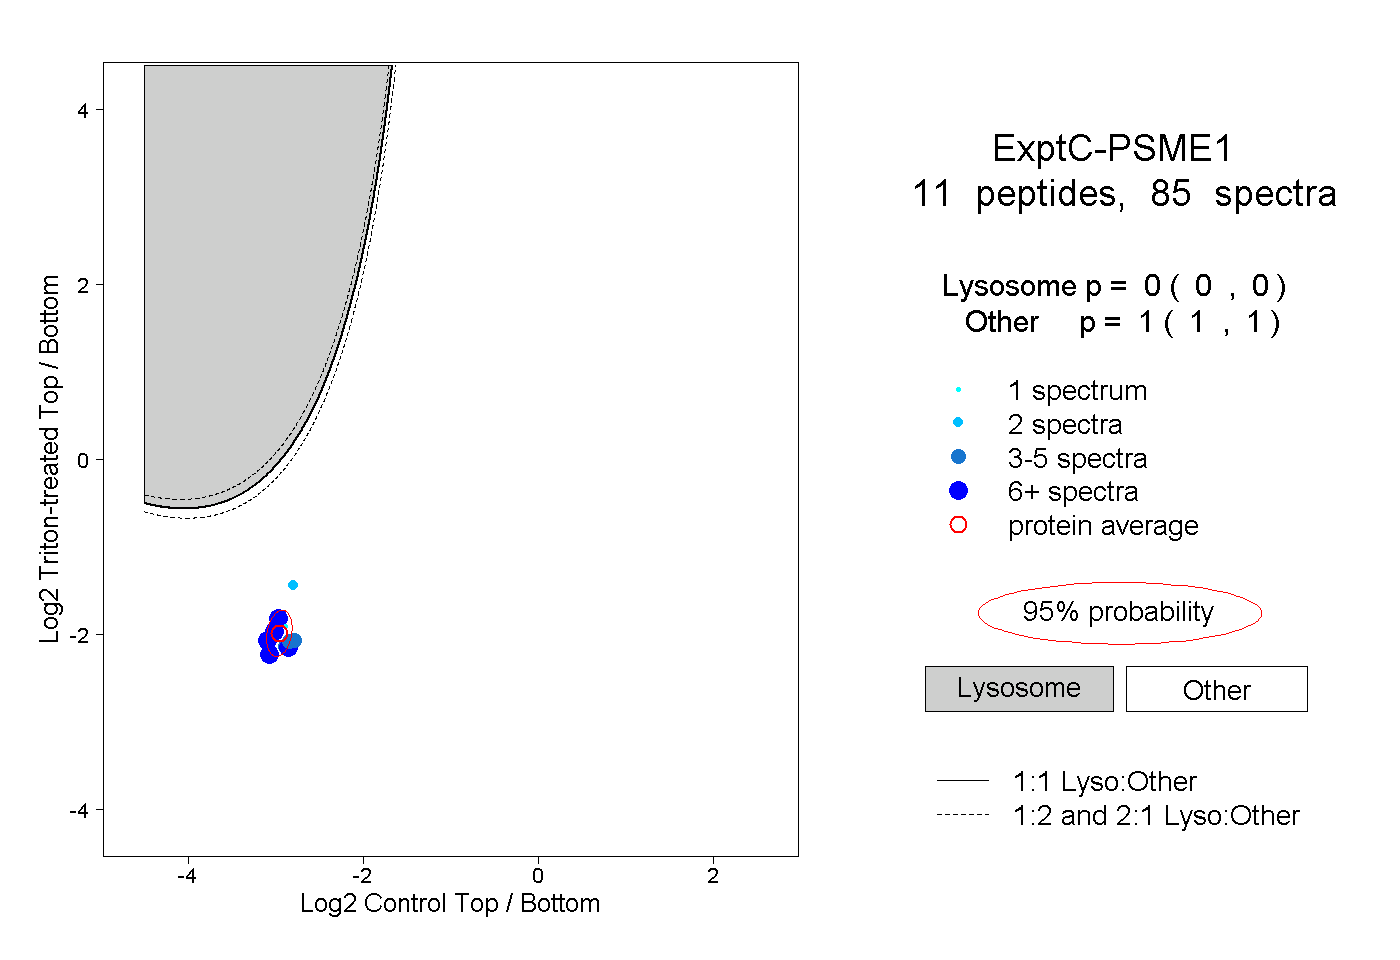
15
15peptides
spectra
0.000 | 0.000
0.000 | 0.005
0.000 | 0.000
0.000 | 0.000
0.036 | 0.045
0.000 | 0.000
0.953 | 0.961
0.000 | 0.000
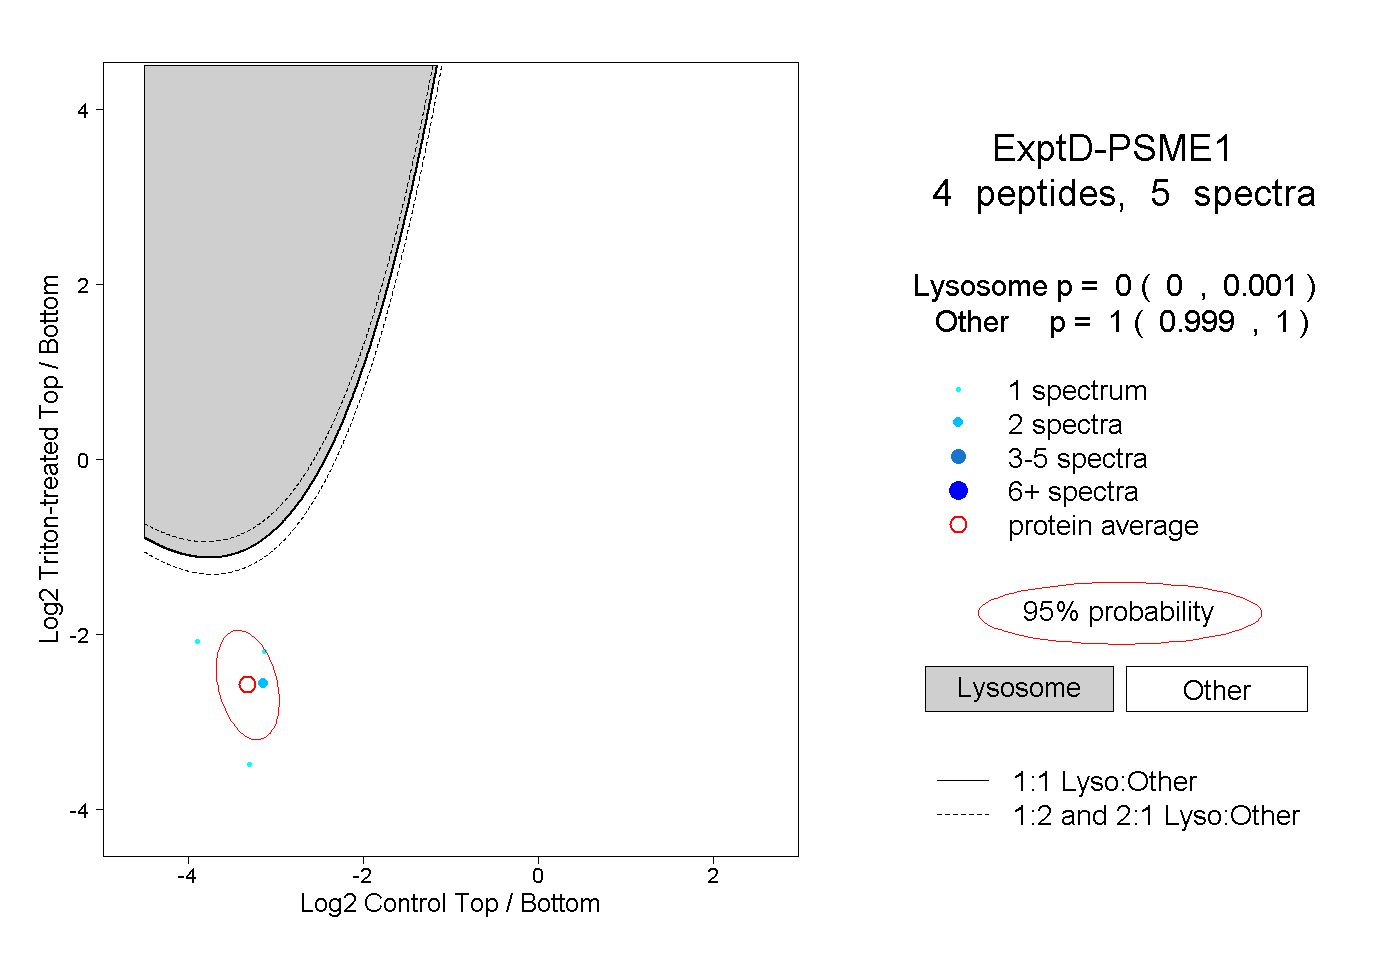
8peptides
spectra

0.000 | 0.000
0.000 | 0.000
0.000 | 0.000
0.000 | 0.005
0.000 | 0.000
0.993 | 1.000
0.000 | 0.000