 15
15peptides
spectra
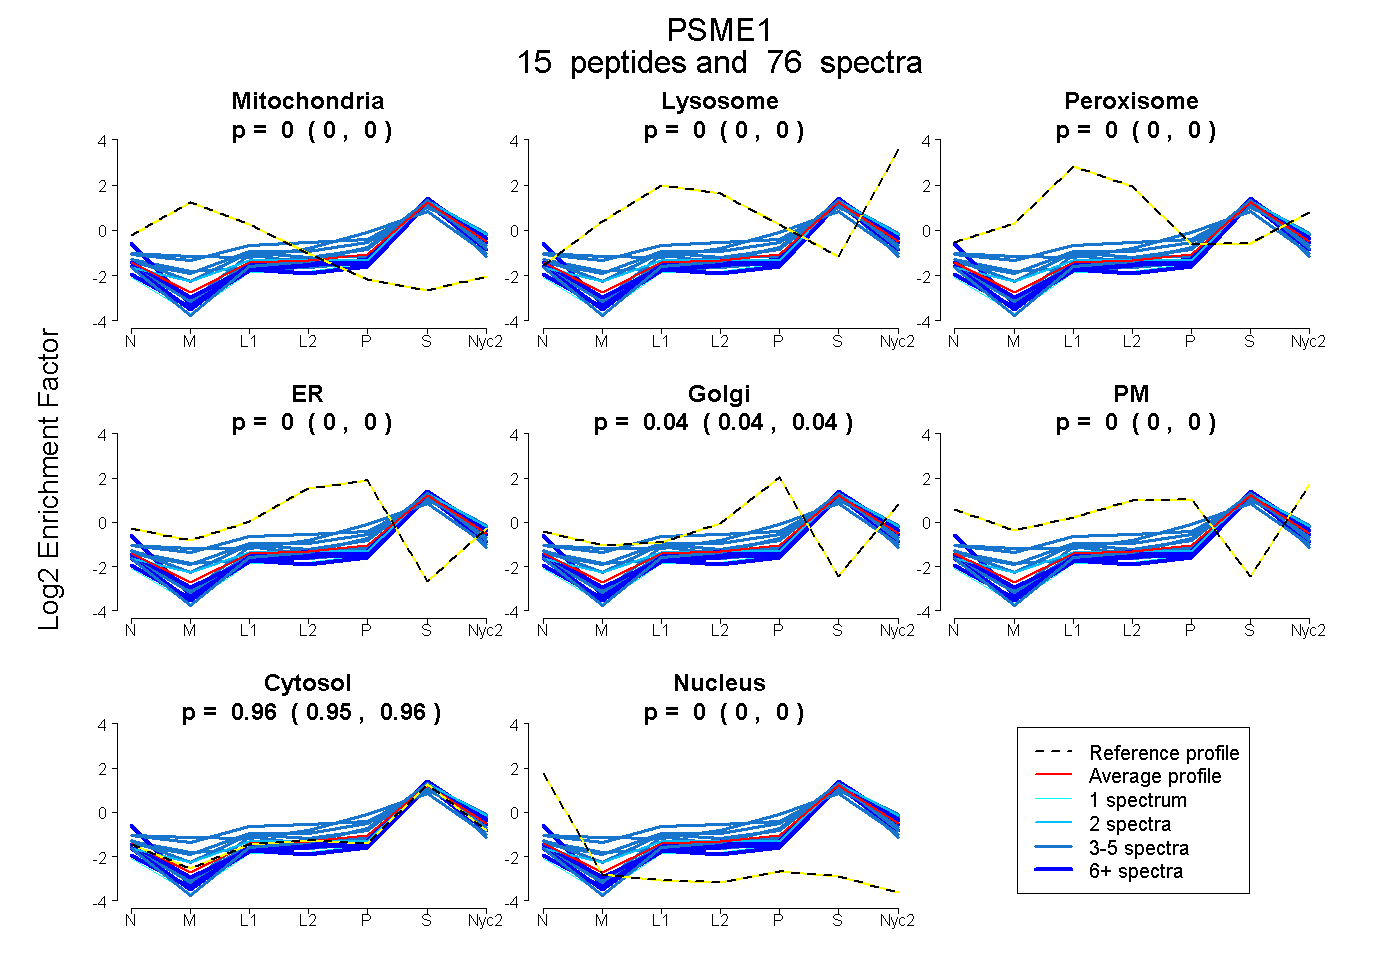
0.000 | 0.000
0.000 | 0.005
0.000 | 0.000
0.000 | 0.000
0.036 | 0.045
0.000 | 0.000
0.953 | 0.961
0.000 | 0.000
| Plot | Mito | Lyso | Perox | ER | Golgi | PM | Cytosol | Nucleus | |||||
| Expt A |
15 peptides |
76 spectra |
|
0.000 0.000 | 0.000 |
0.001 0.000 | 0.005 |
0.000 0.000 | 0.000 |
0.000 0.000 | 0.000 |
0.041 0.036 | 0.045 |
0.000 0.000 | 0.000 |
0.958 0.953 | 0.961 |
0.000 0.000 | 0.000 |
| 3 spectra, LMVMEIR | 0.000 | 0.000 | 0.058 | 0.000 | 0.057 | 0.000 | 0.885 | 0.000 | ||
| 14 spectra, IVVLLQR | 0.000 | 0.000 | 0.000 | 0.000 | 0.000 | 0.000 | 1.000 | 0.000 | ||
| 3 spectra, LEGFQTQISK | 0.000 | 0.009 | 0.000 | 0.000 | 0.056 | 0.000 | 0.935 | 0.000 | ||
| 7 spectra, GDAVAK | 0.000 | 0.000 | 0.000 | 0.000 | 0.000 | 0.000 | 0.881 | 0.119 | ||
| 4 spectra, ISELDAFLK | 0.000 | 0.115 | 0.000 | 0.000 | 0.082 | 0.000 | 0.803 | 0.000 | ||
| 2 spectra, TENLLGSYFPK | 0.000 | 0.070 | 0.000 | 0.000 | 0.000 | 0.000 | 0.930 | 0.000 | ||
| 12 spectra, QLVHELDEAEYQEIR | 0.000 | 0.000 | 0.000 | 0.000 | 0.000 | 0.000 | 1.000 | 0.000 | ||
| 3 spectra, IEDGNNFGVAVQEK | 0.000 | 0.053 | 0.153 | 0.000 | 0.109 | 0.000 | 0.685 | 0.000 | ||
| 5 spectra, EDLCSK | 0.000 | 0.000 | 0.000 | 0.000 | 0.000 | 0.000 | 0.954 | 0.046 | ||
| 4 spectra, QPHVGDYR | 0.057 | 0.000 | 0.009 | 0.152 | 0.072 | 0.000 | 0.710 | 0.000 | ||
| 4 spectra, EPALNEANLSNLK | 0.000 | 0.076 | 0.000 | 0.000 | 0.027 | 0.000 | 0.897 | 0.000 | ||
| 7 spectra, NAYAVLYDIILK | 0.000 | 0.000 | 0.000 | 0.000 | 0.000 | 0.000 | 1.000 | 0.000 | ||
| 4 spectra, GFELMTSLHTK | 0.000 | 0.019 | 0.000 | 0.000 | 0.000 | 0.000 | 0.981 | 0.000 | ||
| 3 spectra, VHPEAQAK | 0.000 | 0.000 | 0.000 | 0.000 | 0.000 | 0.000 | 1.000 | 0.000 | ||
| 1 spectrum, APLDIPVPDPVK | 0.000 | 0.000 | 0.000 | 0.000 | 0.000 | 0.000 | 1.000 | 0.000 |
| Plot | Mito | Lyso or Perox | ER | Golgi | PM | Cytosol | Nucleus | ||||||
| Expt B |
8 peptides |
30 spectra |
 |
0.000 0.000 | 0.000 |
0.000 0.000 | 0.000 |
0.000 0.000 | 0.000 |
0.000 0.000 | 0.005 |
0.000 0.000 | 0.000 |
1.000 0.993 | 1.000 |
0.000 0.000 | 0.000 |
|||
| Plot | Lyso | Other | |||||||||||
| Expt C |
11 peptides |
85 spectra |
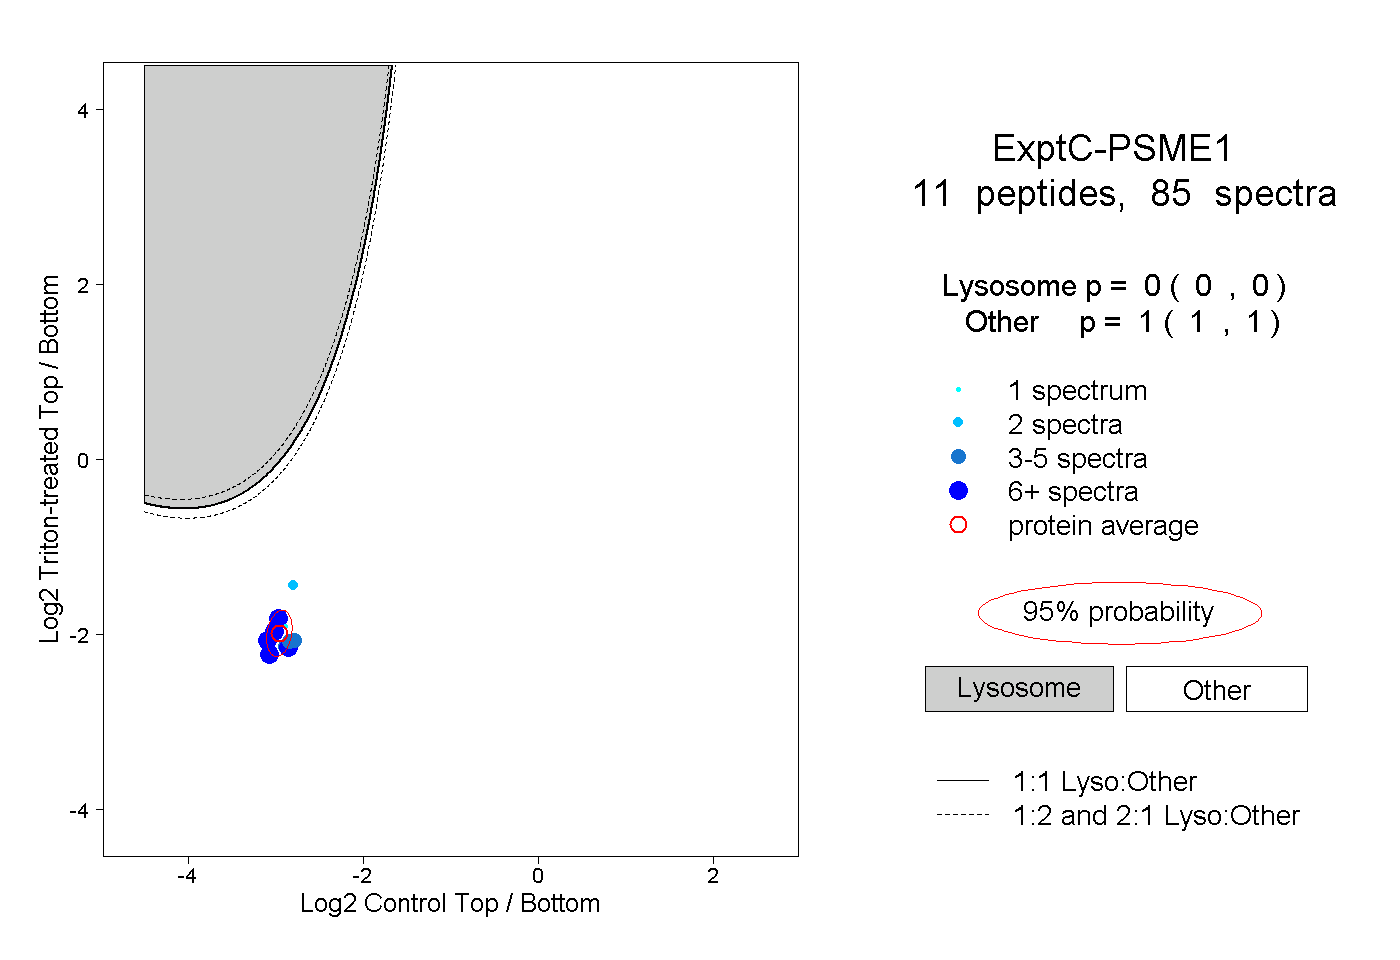 |
0.000 0.000 | 0.000 |
1.000 1.000 | 1.000 |
||||||||
| Plot | Lyso | Other | |||||||||||
| Expt D |
4 peptides |
5 spectra |
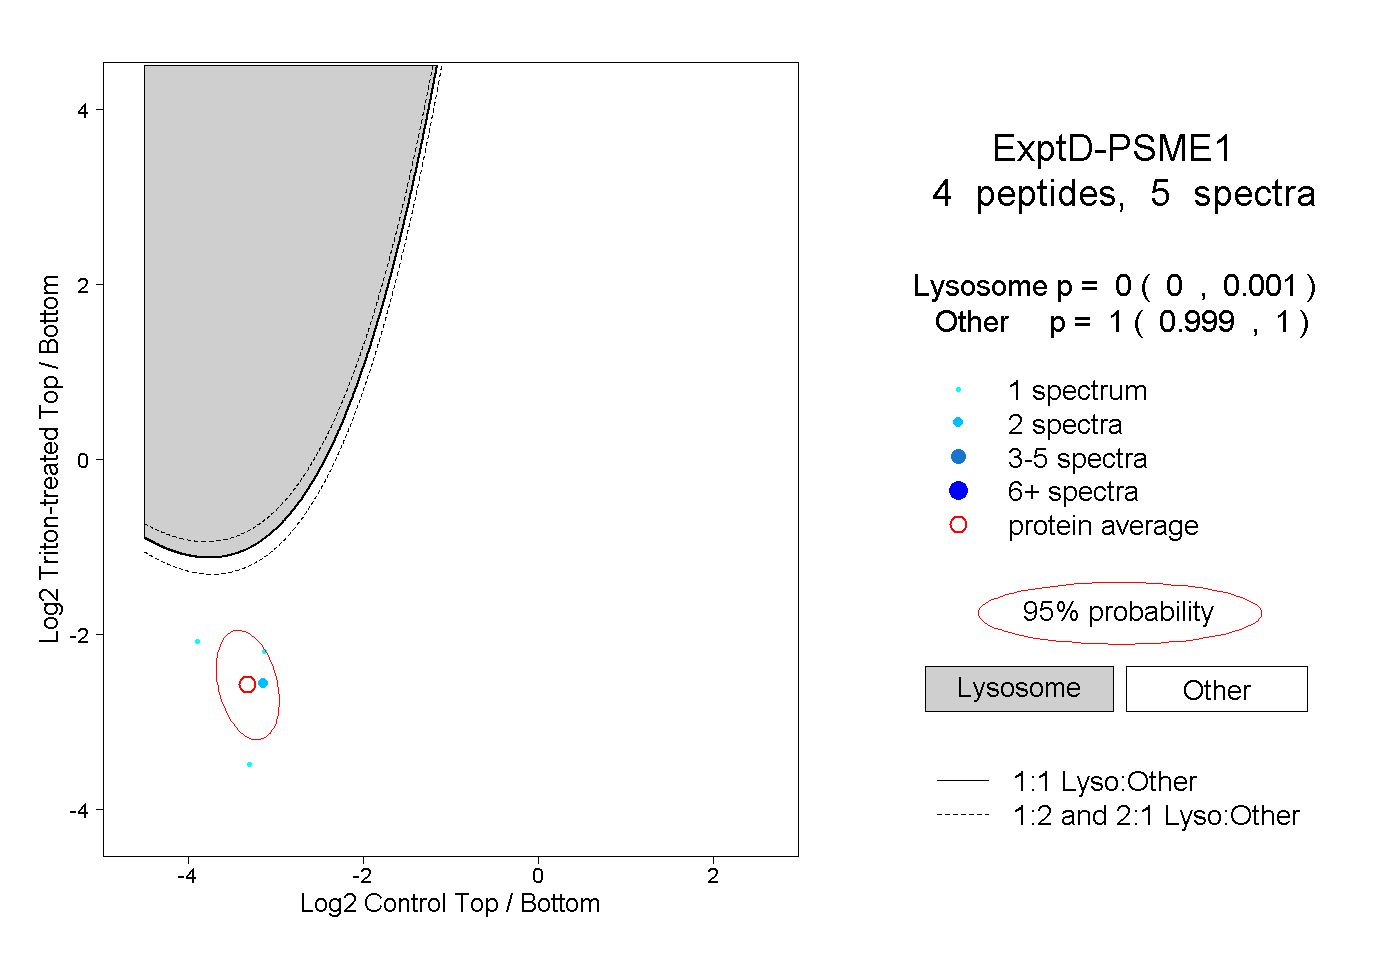 |
0.000 0.000 | 0.001 |
1.000 0.999 | 1.000 |