 21
21peptides
spectra
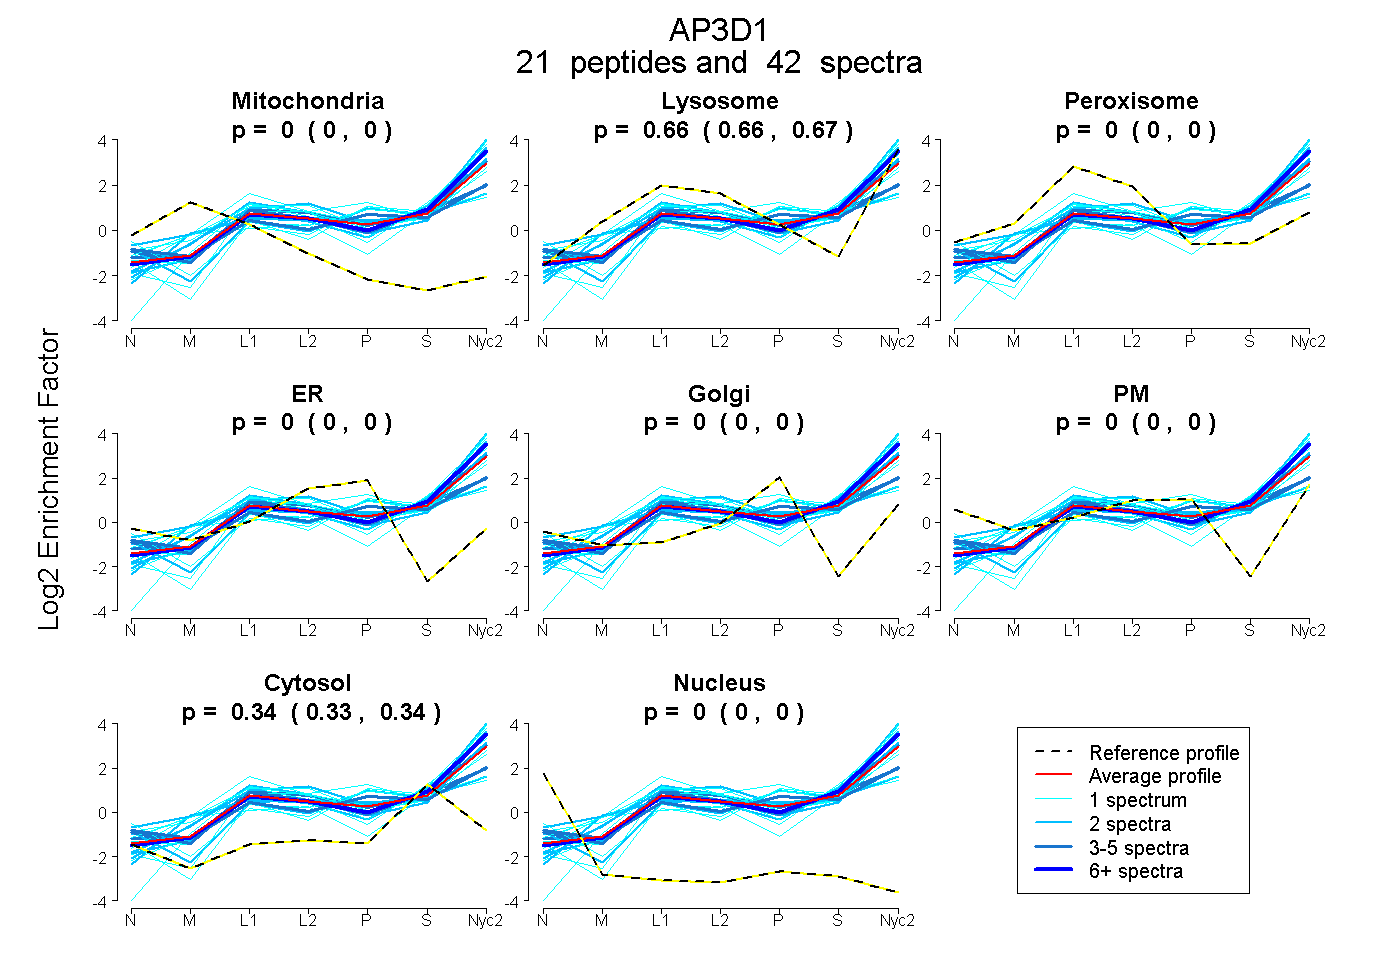
0.000 | 0.000
0.656 | 0.668
0.000 | 0.000
0.000 | 0.000
0.000 | 0.000
0.000 | 0.000
0.332 | 0.342
0.000 | 0.000
11peptides
spectra
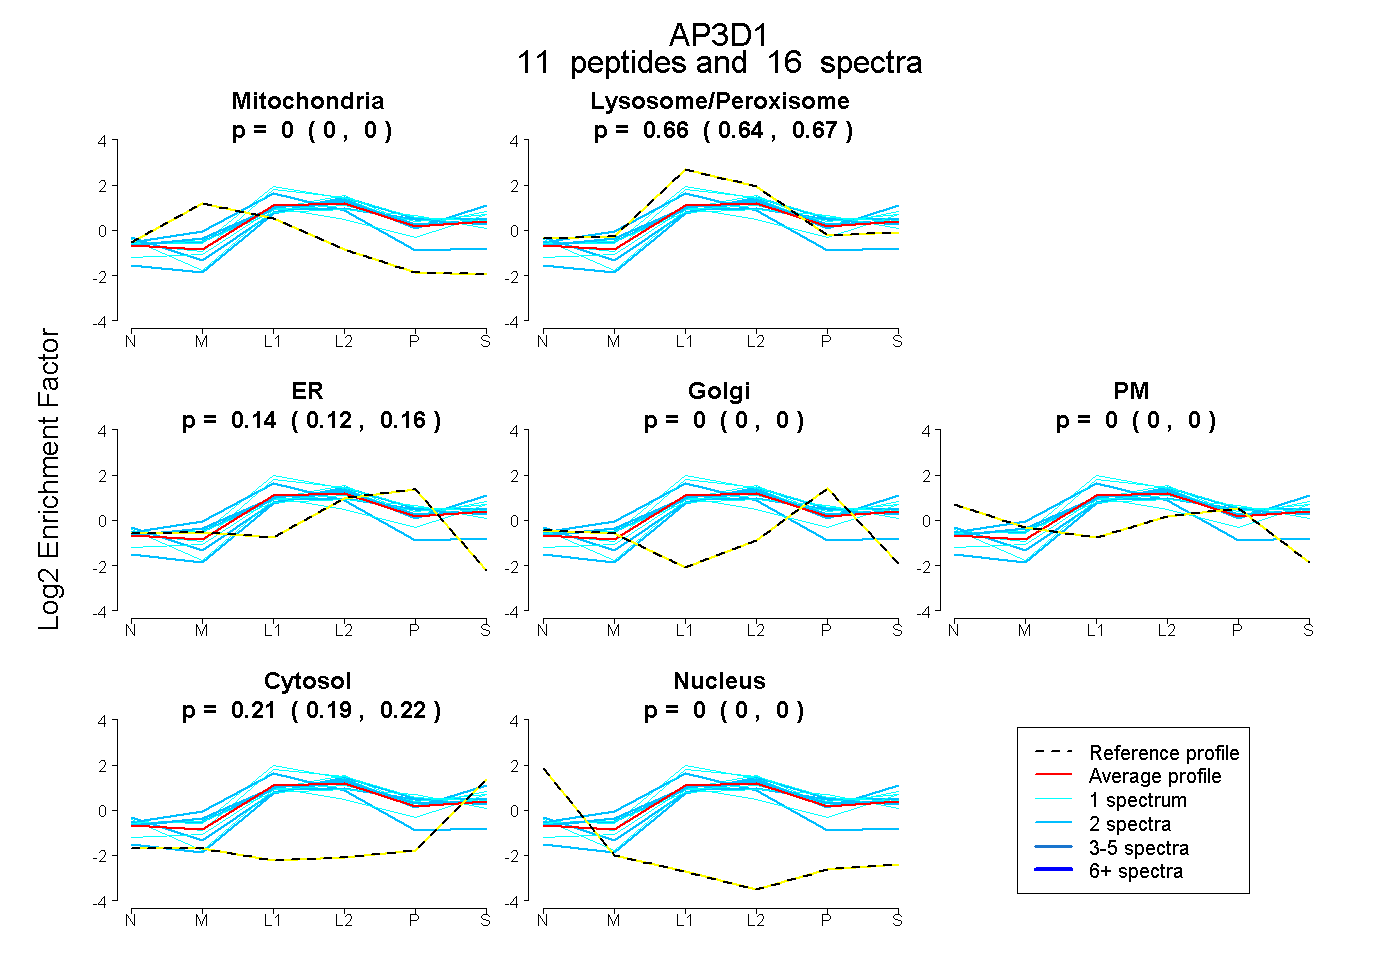
0.000 | 0.000
0.640 | 0.668
0.115 | 0.156
0.000 | 0.000
0.000 | 0.000
0.194 | 0.217
0.000 | 0.000
25peptides
spectra
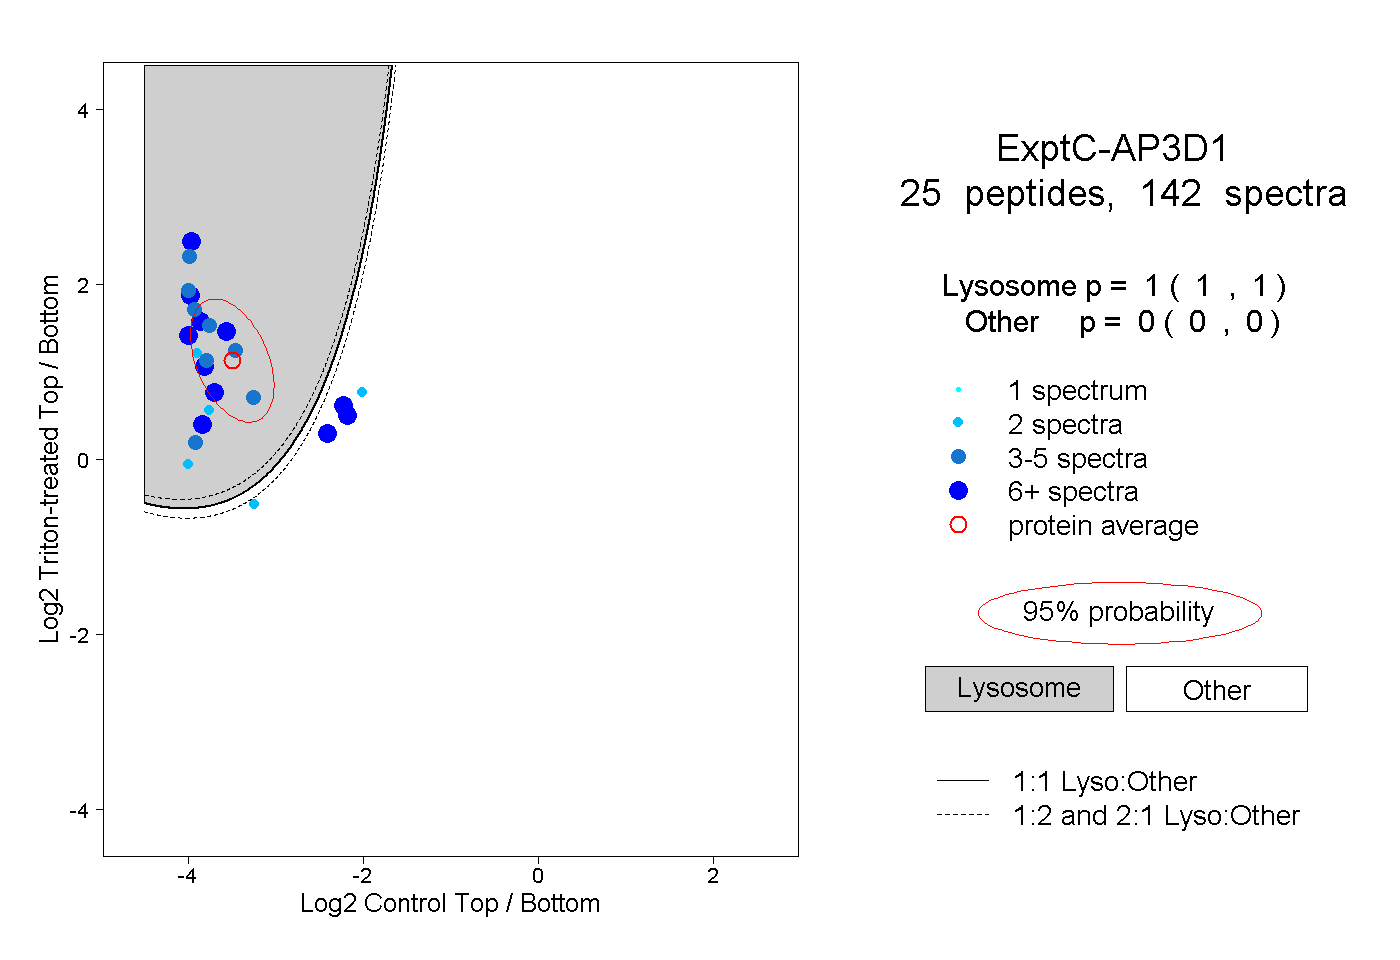
1.000 | 1.000
0.000 | 0.000
5peptides
spectra
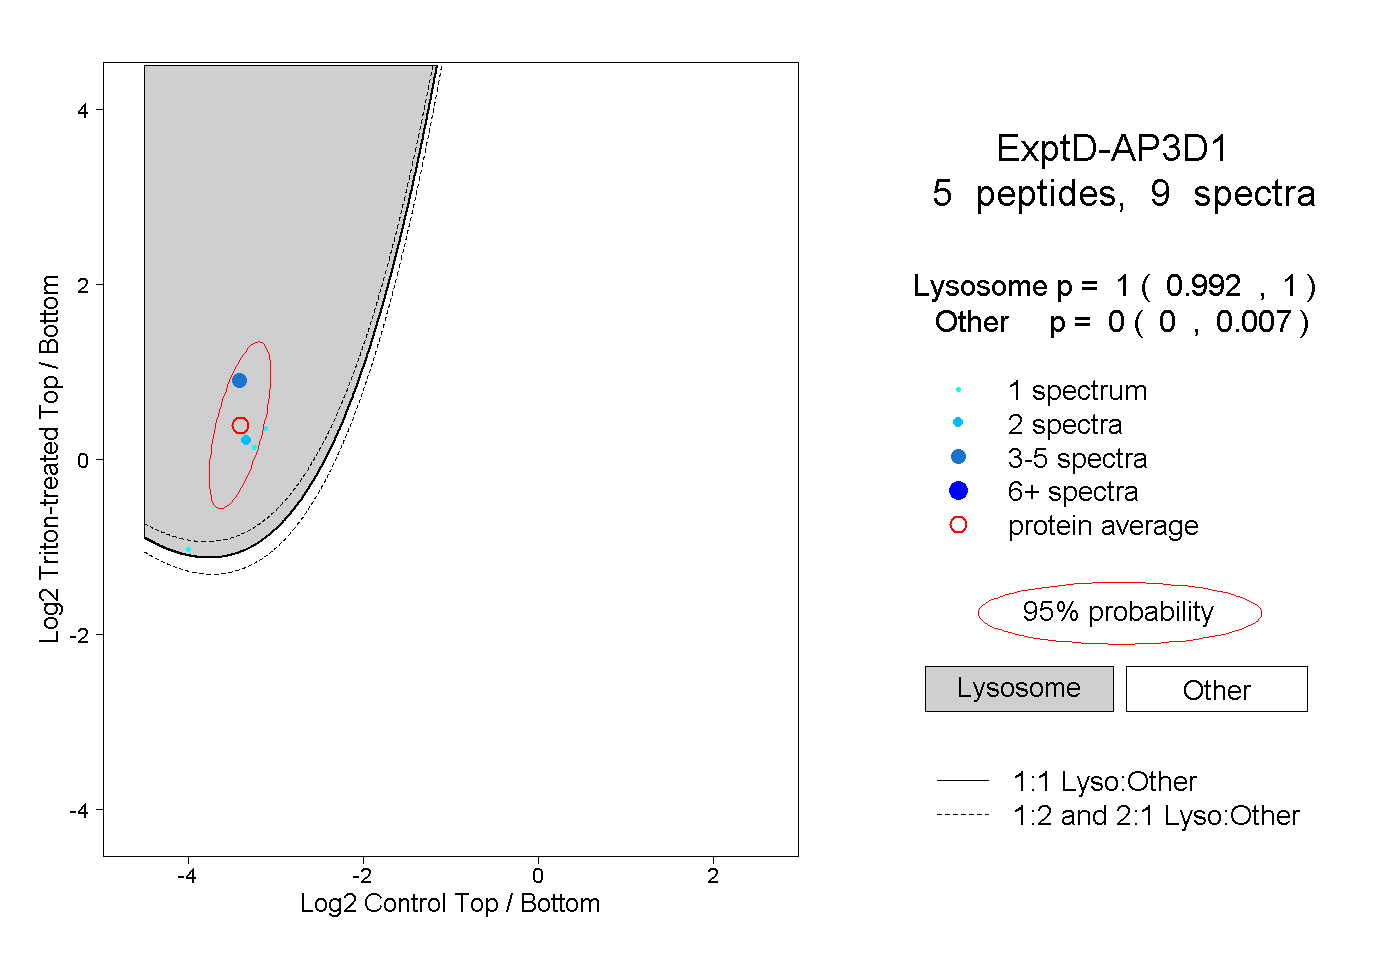
0.992 | 1.000
0.000 | 0.007