 2
2peptides
spectra
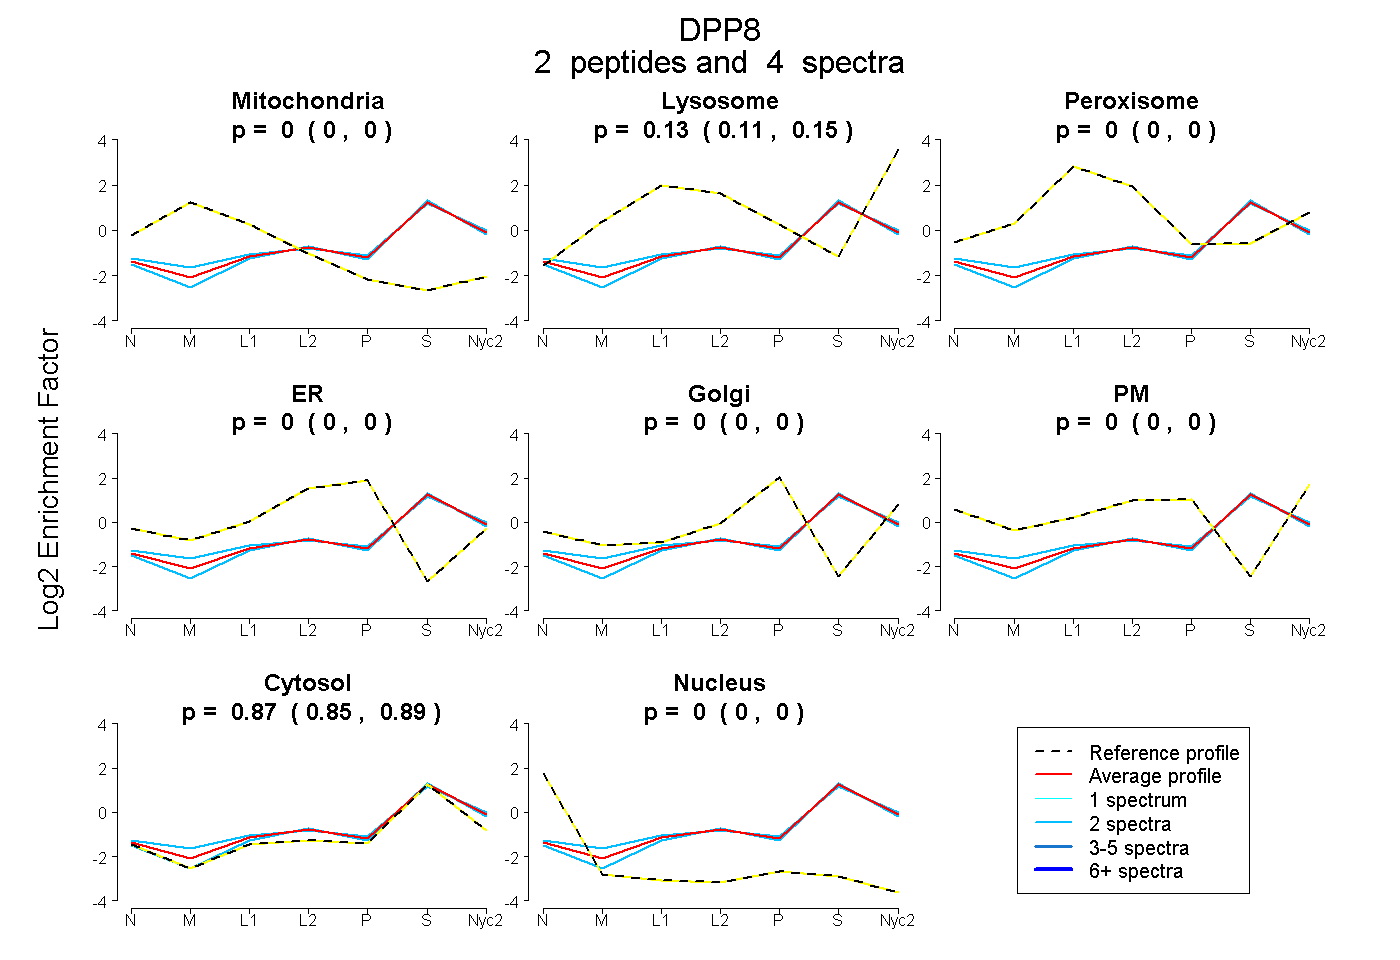
0.000 | 0.000
0.108 | 0.147
0.000 | 0.001
0.000 | 0.000
0.000 | 0.000
0.000 | 0.000
0.848 | 0.888
0.000 | 0.000
| Plot | Mito | Lyso | Perox | ER | Golgi | PM | Cytosol | Nucleus | |||||
| Expt A |
2 peptides |
4 spectra |
|
0.000 0.000 | 0.000 |
0.129 0.108 | 0.147 |
0.000 0.000 | 0.001 |
0.000 0.000 | 0.000 |
0.000 0.000 | 0.000 |
0.000 0.000 | 0.000 |
0.871 0.848 | 0.888 |
0.000 0.000 | 0.000 |
| 2 spectra, YAWSILLDR | 0.001 | 0.168 | 0.000 | 0.000 | 0.000 | 0.000 | 0.832 | 0.000 | ||
| 2 spectra, ADPDGPHSDR | 0.000 | 0.090 | 0.000 | 0.000 | 0.000 | 0.000 | 0.910 | 0.000 |
| Plot | Lyso | Other | |||||||||||
| Expt C |
1 peptide |
2 spectra |
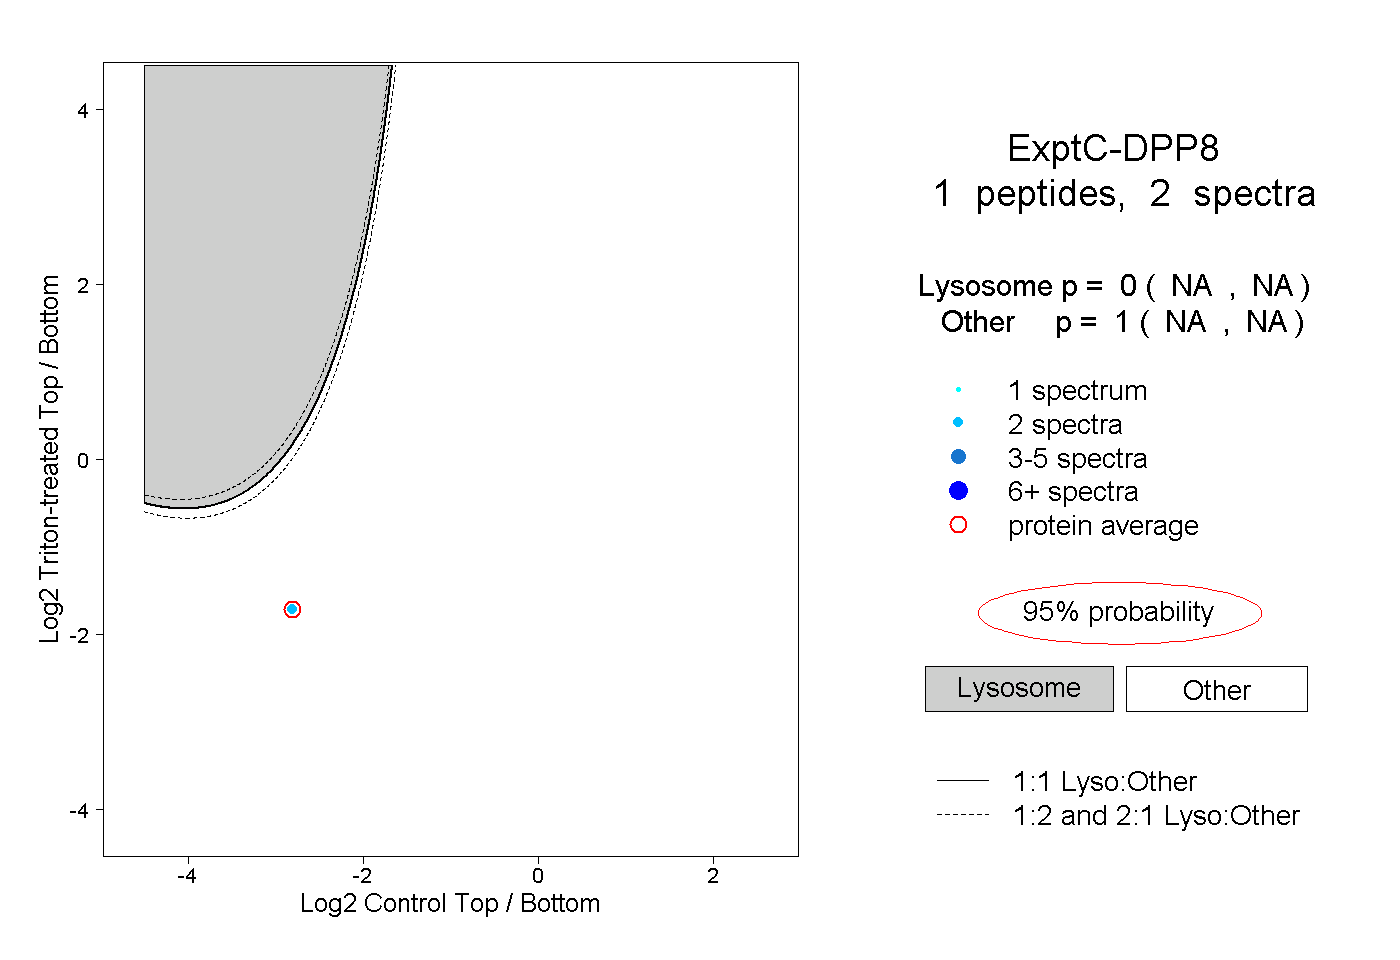 |
0.000 NA | NA |
1.000 NA | NA |