 21
21peptides
spectra
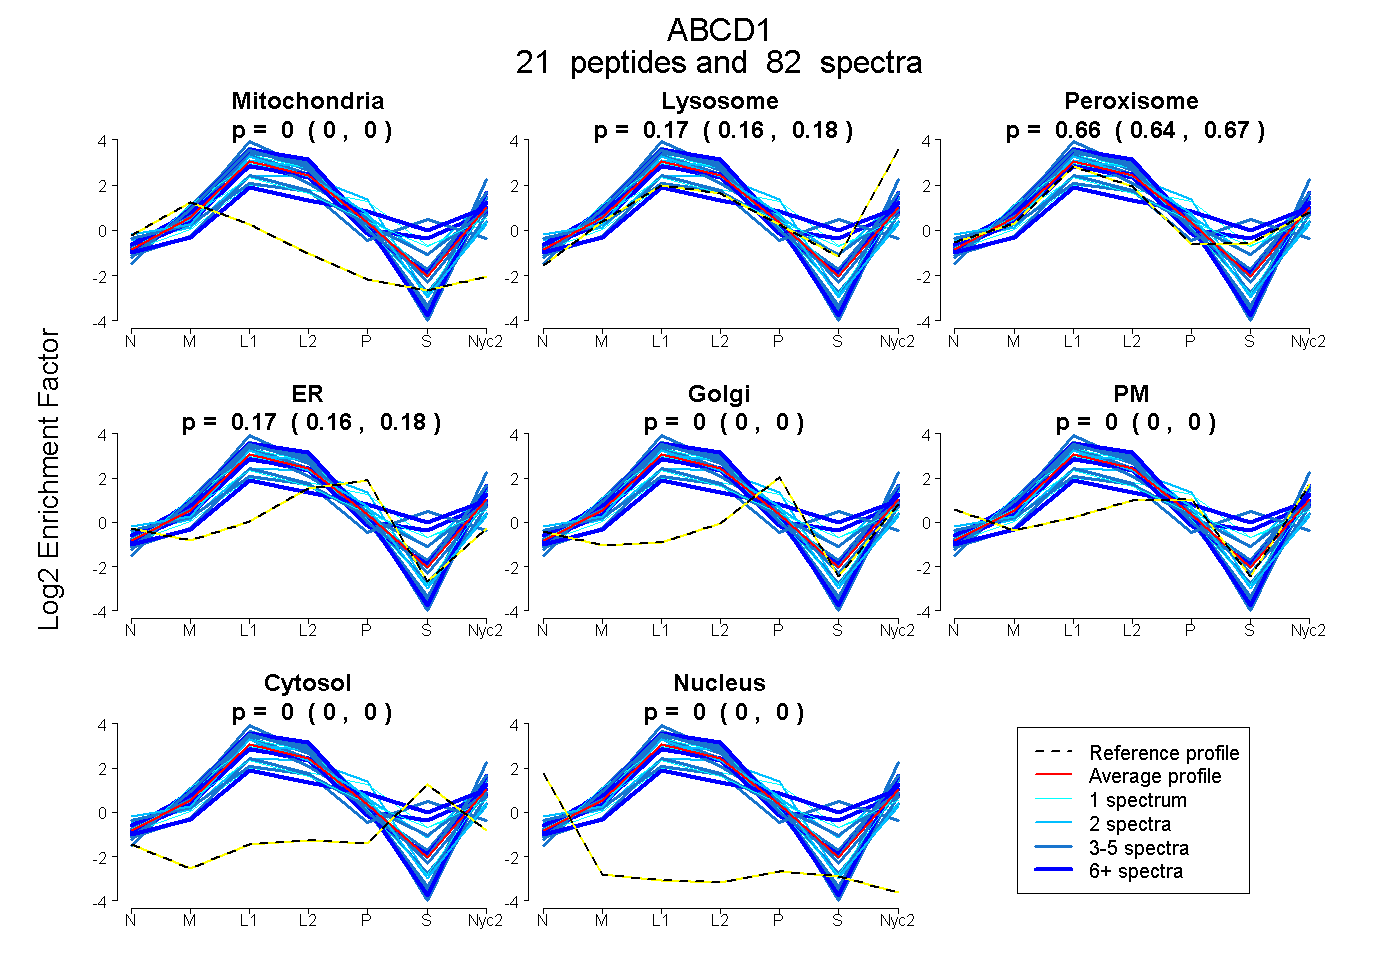
0.000 | 0.000
0.164 | 0.180
0.644 | 0.666
0.163 | 0.178
0.000 | 0.000
0.000 | 0.000
0.000 | 0.000
0.000 | 0.000
15peptides
spectra
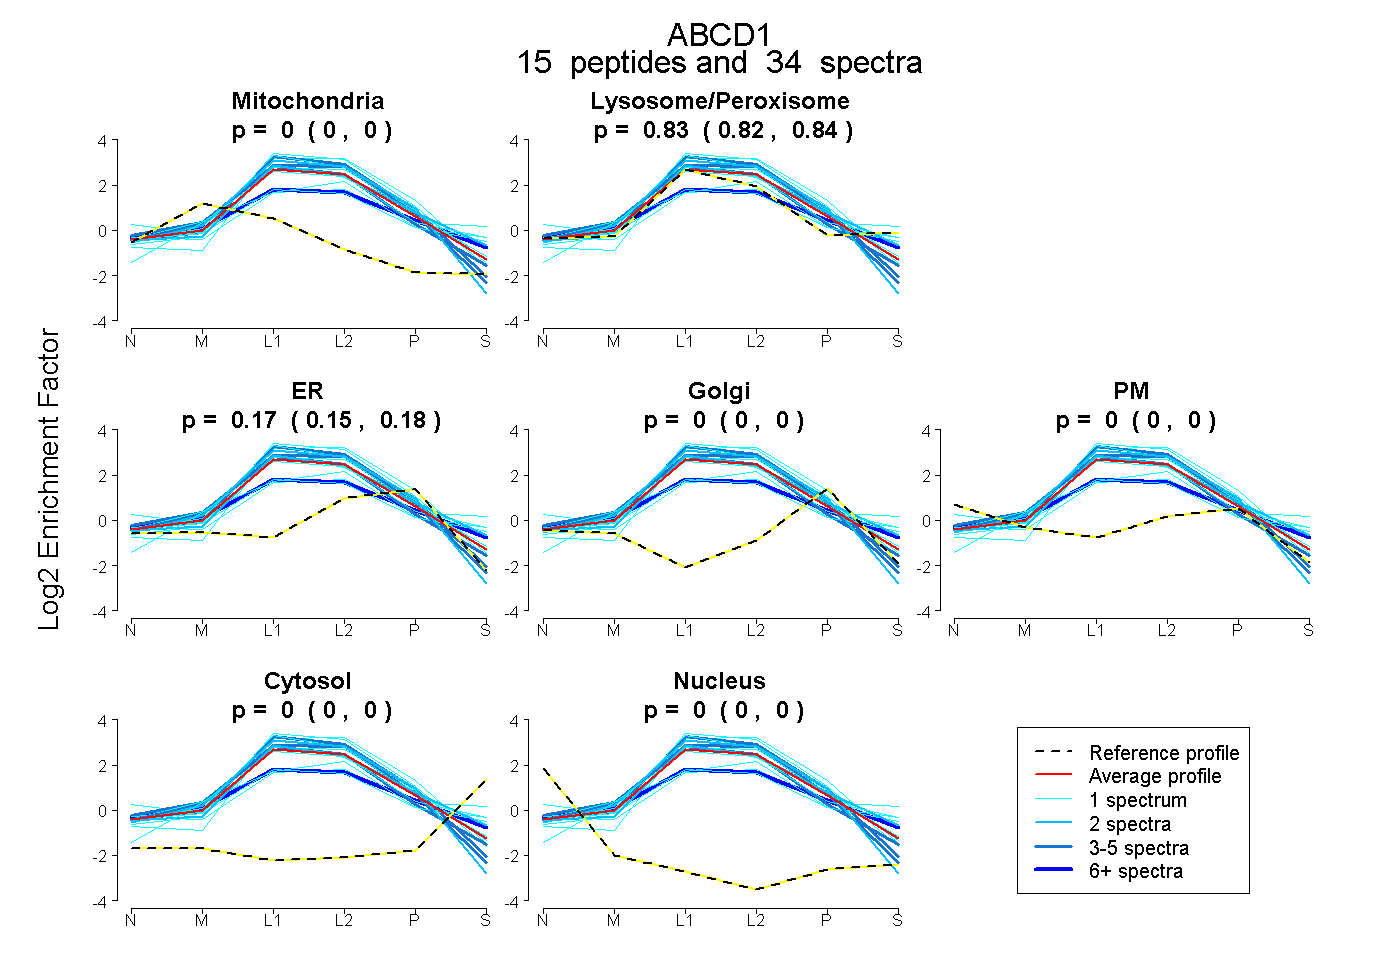
0.000 | 0.000
0.820 | 0.843
0.154 | 0.178
0.000 | 0.000
0.000 | 0.000
0.000 | 0.000
0.000 | 0.000
29peptides
spectra
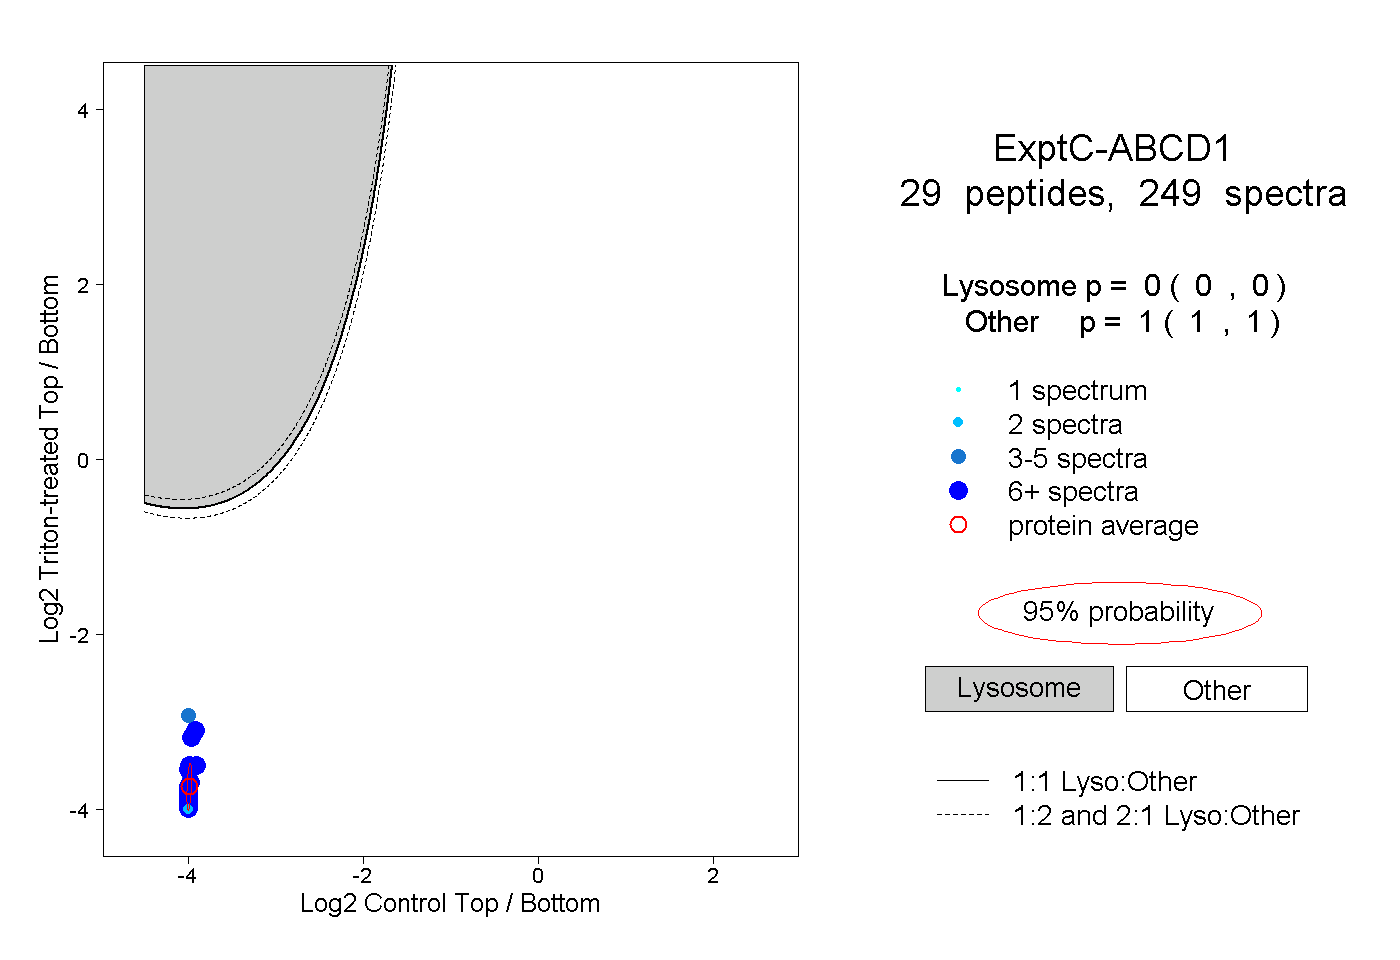
0.000 | 0.000
1.000 | 1.000
13peptides
spectra
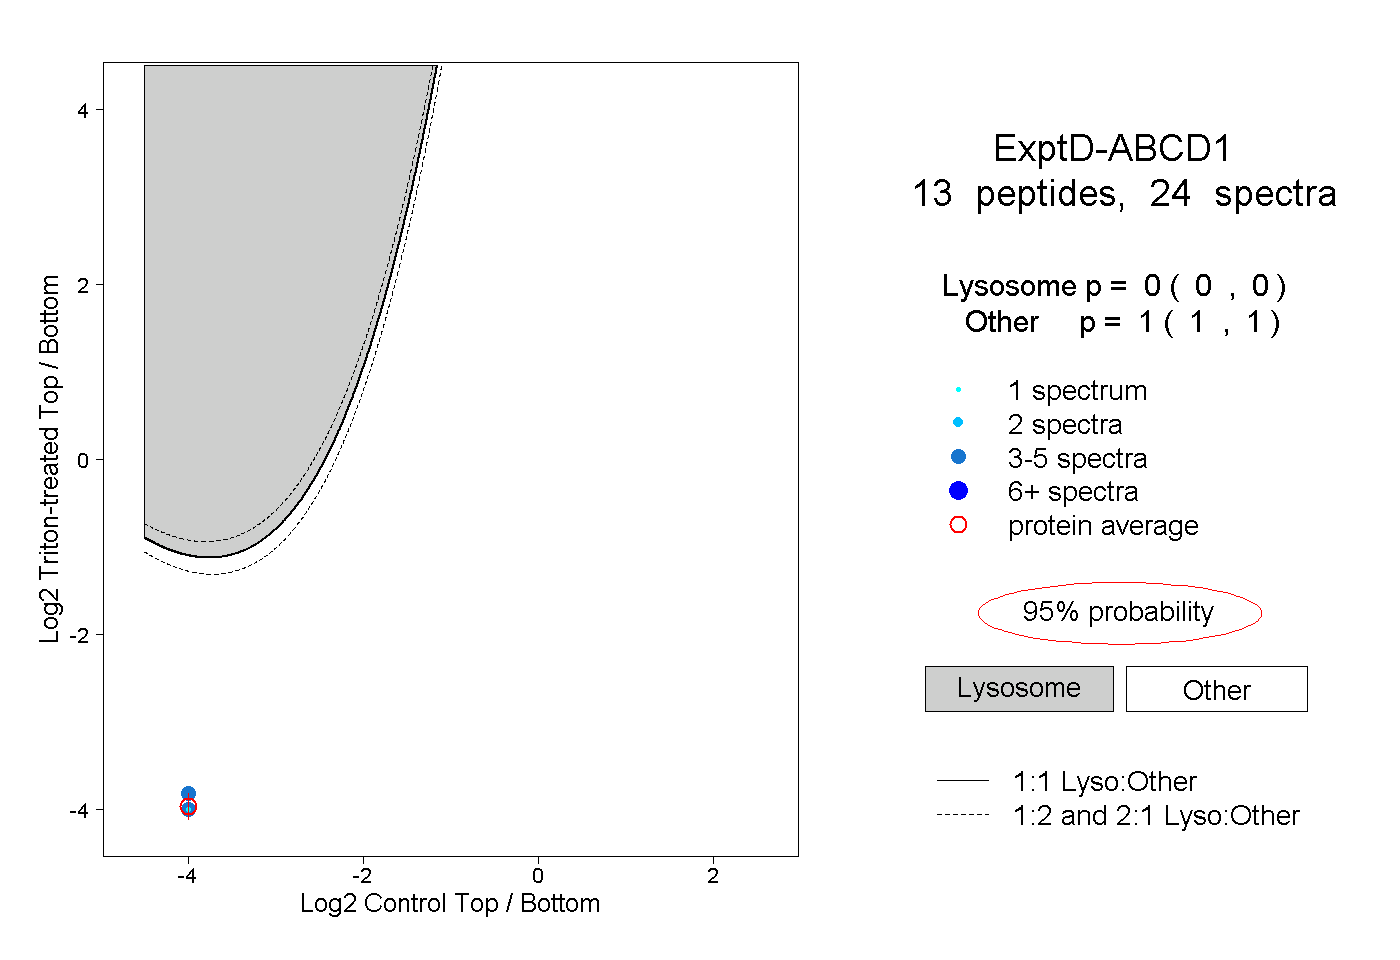
0.000 | 0.000
1.000 | 1.000