 6
6peptides
spectra
0.869 | 0.882
0.000 | 0.000
0.000 | 0.000
0.000 | 0.000
0.000 | 0.000
0.000 | 0.000
0.050 | 0.089
0.032 | 0.070
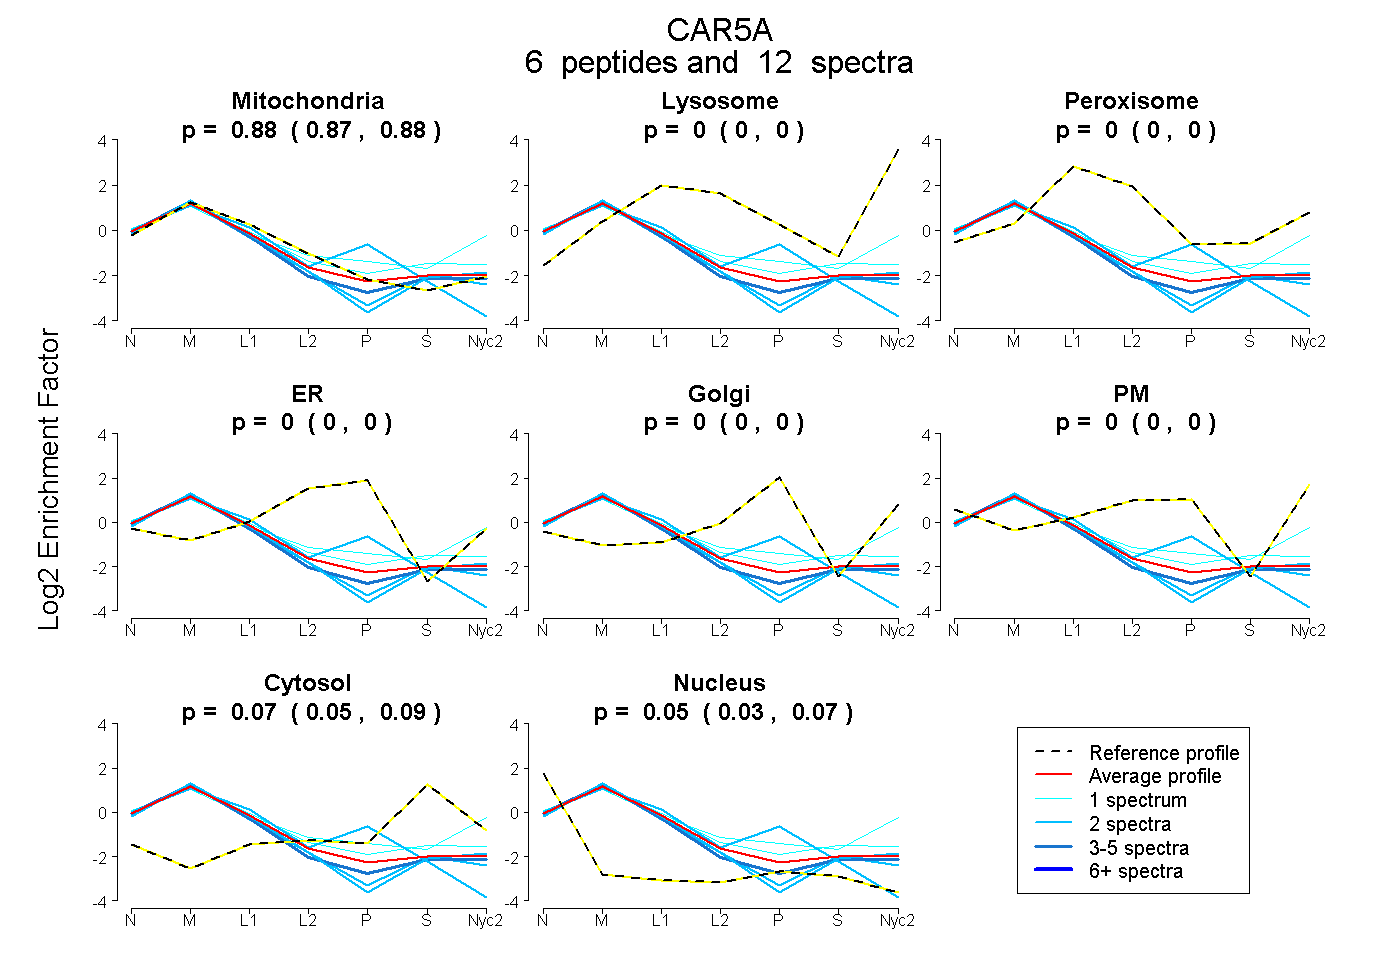
| Plot | Mito | Lyso | Perox | ER | Golgi | PM | Cytosol | Nucleus | |||||
| Expt A |
6 peptides |
12 spectra |
|
0.876 0.869 | 0.882 |
0.000 0.000 | 0.000 |
0.000 0.000 | 0.000 |
0.000 0.000 | 0.000 |
0.000 0.000 | 0.000 |
0.000 0.000 | 0.000 |
0.072 0.050 | 0.089 |
0.052 0.032 | 0.070 |
| 4 spectra, SSFQVPR | 0.870 | 0.000 | 0.000 | 0.000 | 0.000 | 0.000 | 0.018 | 0.112 | ||
| 1 spectrum, LGAHHEALQR | 0.613 | 0.110 | 0.000 | 0.000 | 0.000 | 0.154 | 0.101 | 0.022 | ||
| 2 spectra, TLLFSGR | 0.899 | 0.000 | 0.000 | 0.000 | 0.000 | 0.000 | 0.024 | 0.077 | ||
| 2 spectra, VSYDAASCR | 0.802 | 0.000 | 0.000 | 0.072 | 0.000 | 0.000 | 0.000 | 0.126 | ||
| 2 spectra, LVDILPEVR | 0.868 | 0.000 | 0.000 | 0.000 | 0.000 | 0.000 | 0.006 | 0.127 | ||
| 1 spectrum, GEDEEVMVNNFRPLQPLR | 0.813 | 0.022 | 0.000 | 0.000 | 0.000 | 0.000 | 0.165 | 0.000 |
| Plot | Mito | Lyso or Perox | ER | Golgi | PM | Cytosol | Nucleus | ||||||
| Expt B |
5 peptides |
7 spectra |
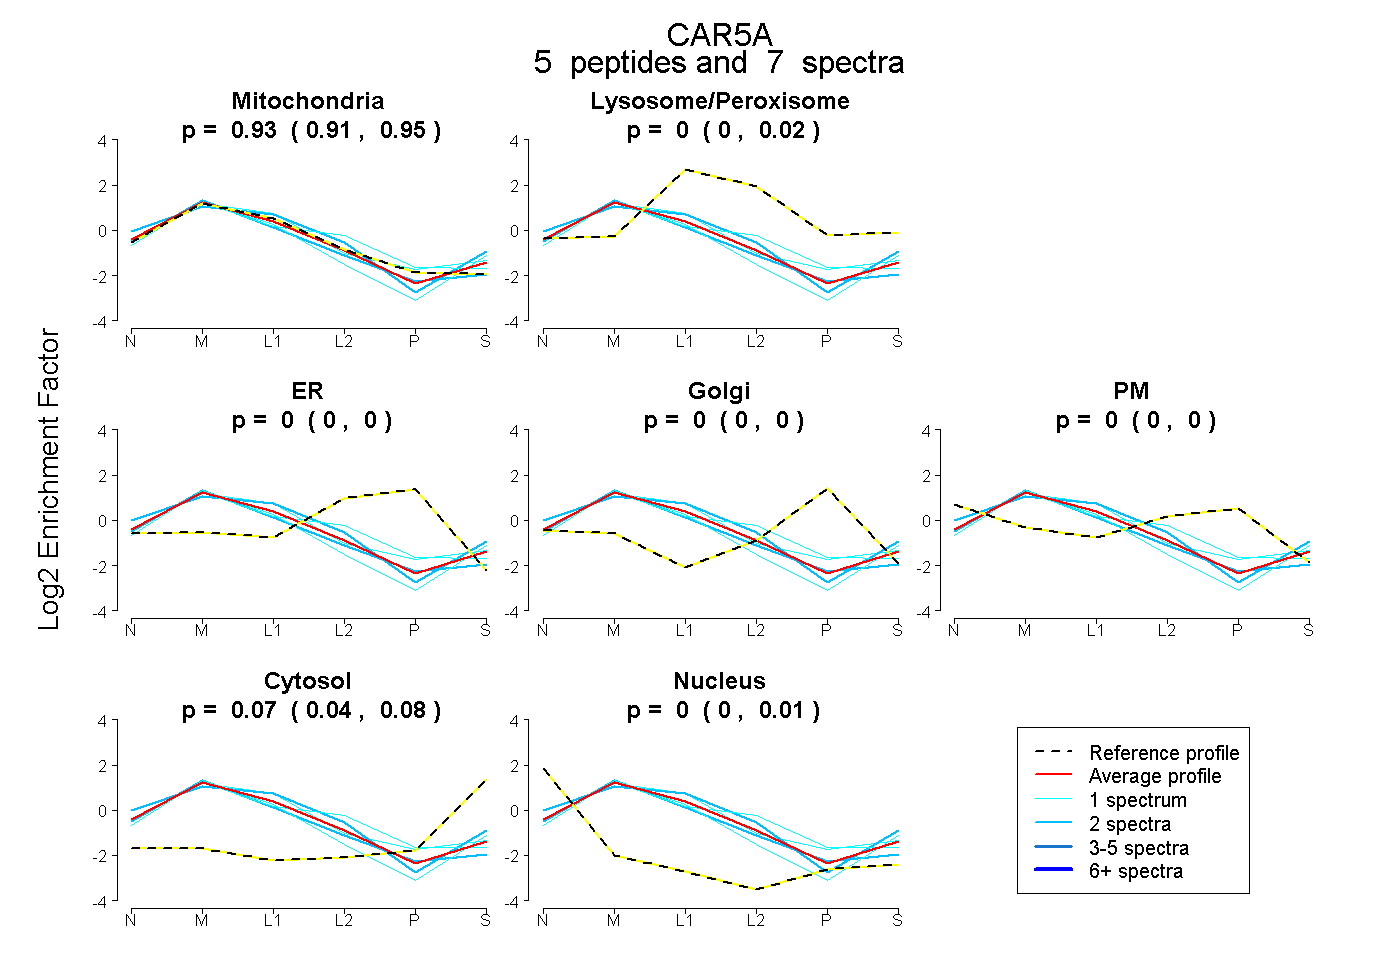 |
0.934 0.909 | 0.948 |
0.000 0.000 | 0.016 |
0.000 0.000 | 0.000 |
0.000 0.000 | 0.000 |
0.000 0.000 | 0.000 |
0.066 0.044 | 0.082 |
0.000 0.000 | 0.010 |
|||
| Plot | Lyso | Other | |||||||||||
| Expt C |
7 peptides |
32 spectra |
 |
0.000 0.000 | 0.000 |
1.000 1.000 | 1.000 |
||||||||
| Plot | Lyso | Other | |||||||||||
| Expt D |
2 peptides |
3 spectra |
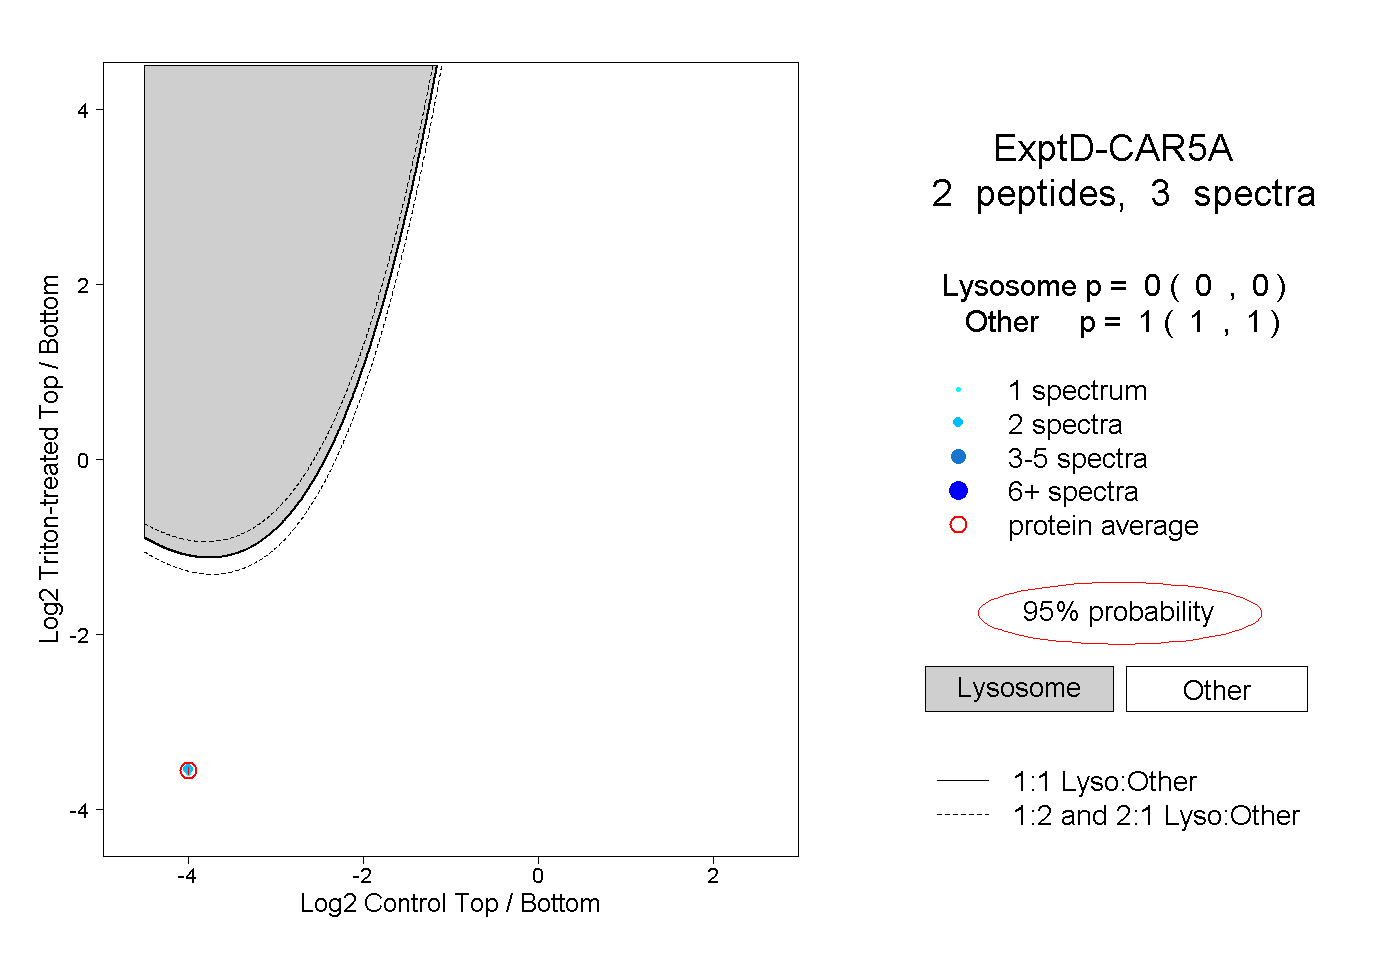 |
0.000 0.000 | 0.000 |
1.000 1.000 | 1.000 |