 1
1peptide
spectra
0.000 | 0.000
0.068 | 0.170
0.000 | 0.072
0.000 | 0.001
0.254 | 0.343
0.000 | 0.000
0.510 | 0.560
0.000 | 0.000
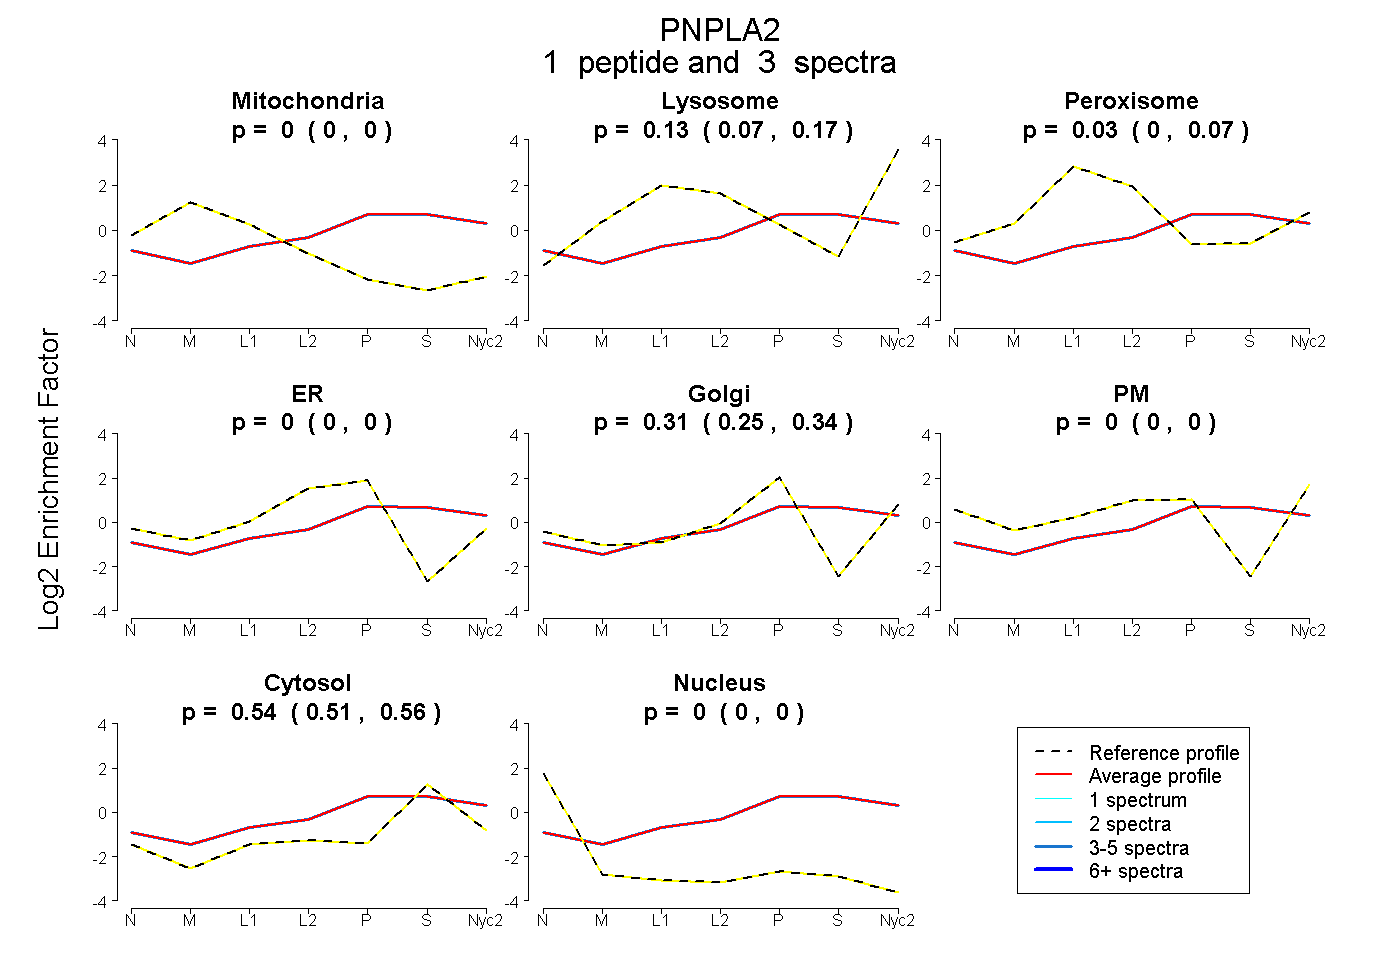
| Plot | Mito | Lyso | Perox | ER | Golgi | PM | Cytosol | Nucleus | |||||
| Expt A |
1 peptide |
3 spectra |
|
0.000 0.000 | 0.000 |
0.131 0.068 | 0.170 |
0.027 0.000 | 0.072 |
0.000 0.000 | 0.001 |
0.306 0.254 | 0.343 |
0.000 0.000 | 0.000 |
0.537 0.510 | 0.560 |
0.000 0.000 | 0.000 |