12
12peptides
spectra
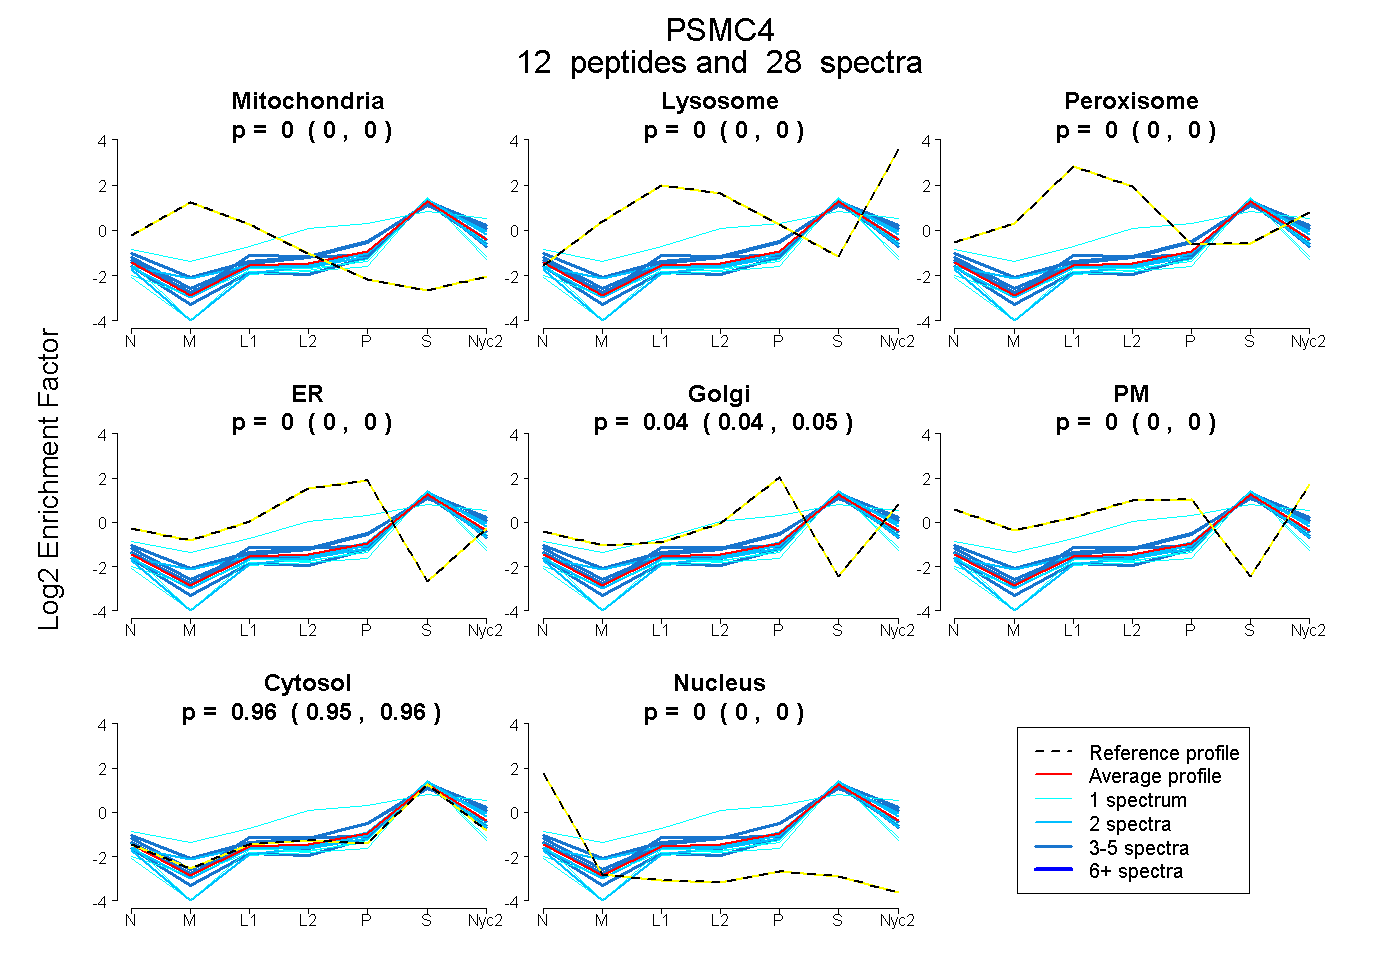
0.000 | 0.000
0.000 | 0.000
0.000 | 0.000
0.000 | 0.000
0.038 | 0.050
0.000 | 0.000
0.949 | 0.961
0.000 | 0.000
3peptides
spectra
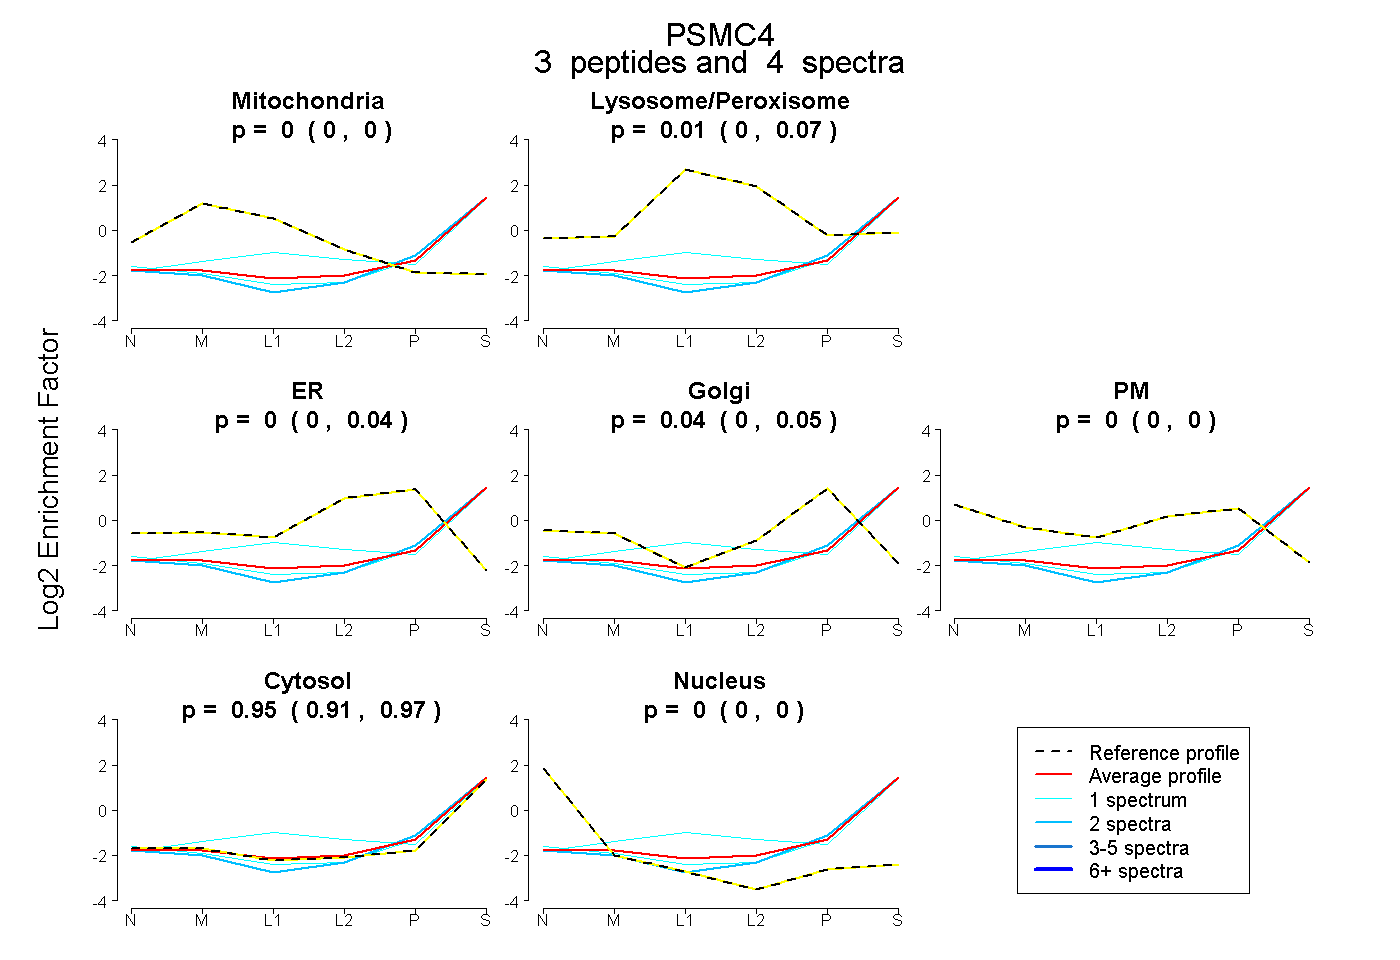
0.000 | 0.000
0.000 | 0.075
0.000 | 0.045
0.000 | 0.054
0.000 | 0.000
0.910 | 0.971
0.000 | 0.000
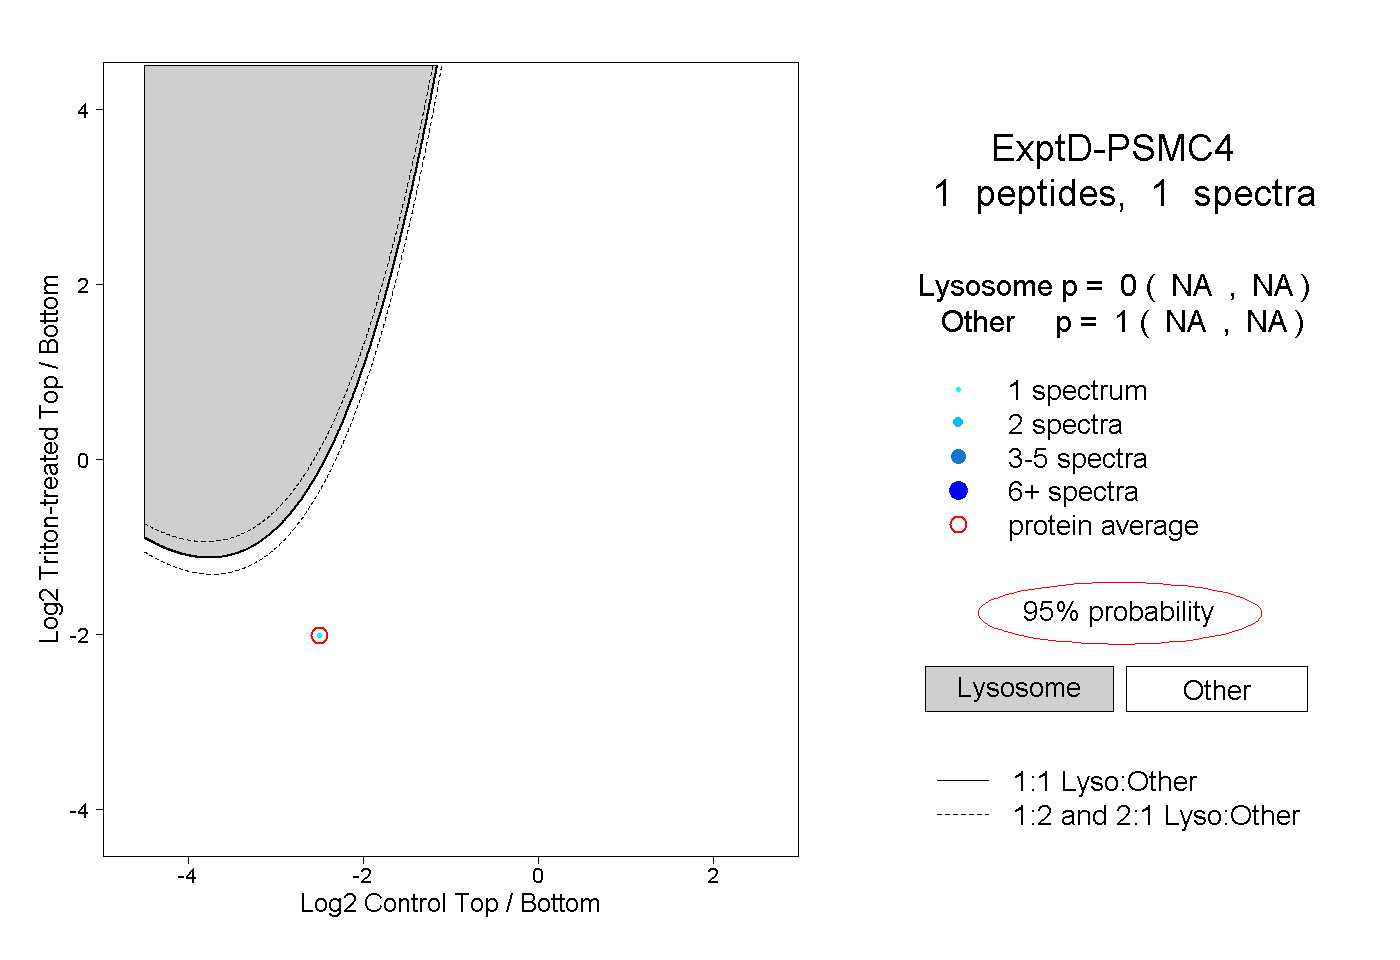
12peptides
spectra
0.000 | 0.000
1.000 | 1.000