 12
12peptides
spectra
0.000 | 0.000
0.000 | 0.000
0.000 | 0.000
0.000 | 0.000
0.038 | 0.050
0.000 | 0.000
0.949 | 0.961
0.000 | 0.000
| Plot | Mito | Lyso | Perox | ER | Golgi | PM | Cytosol | Nucleus | |||||
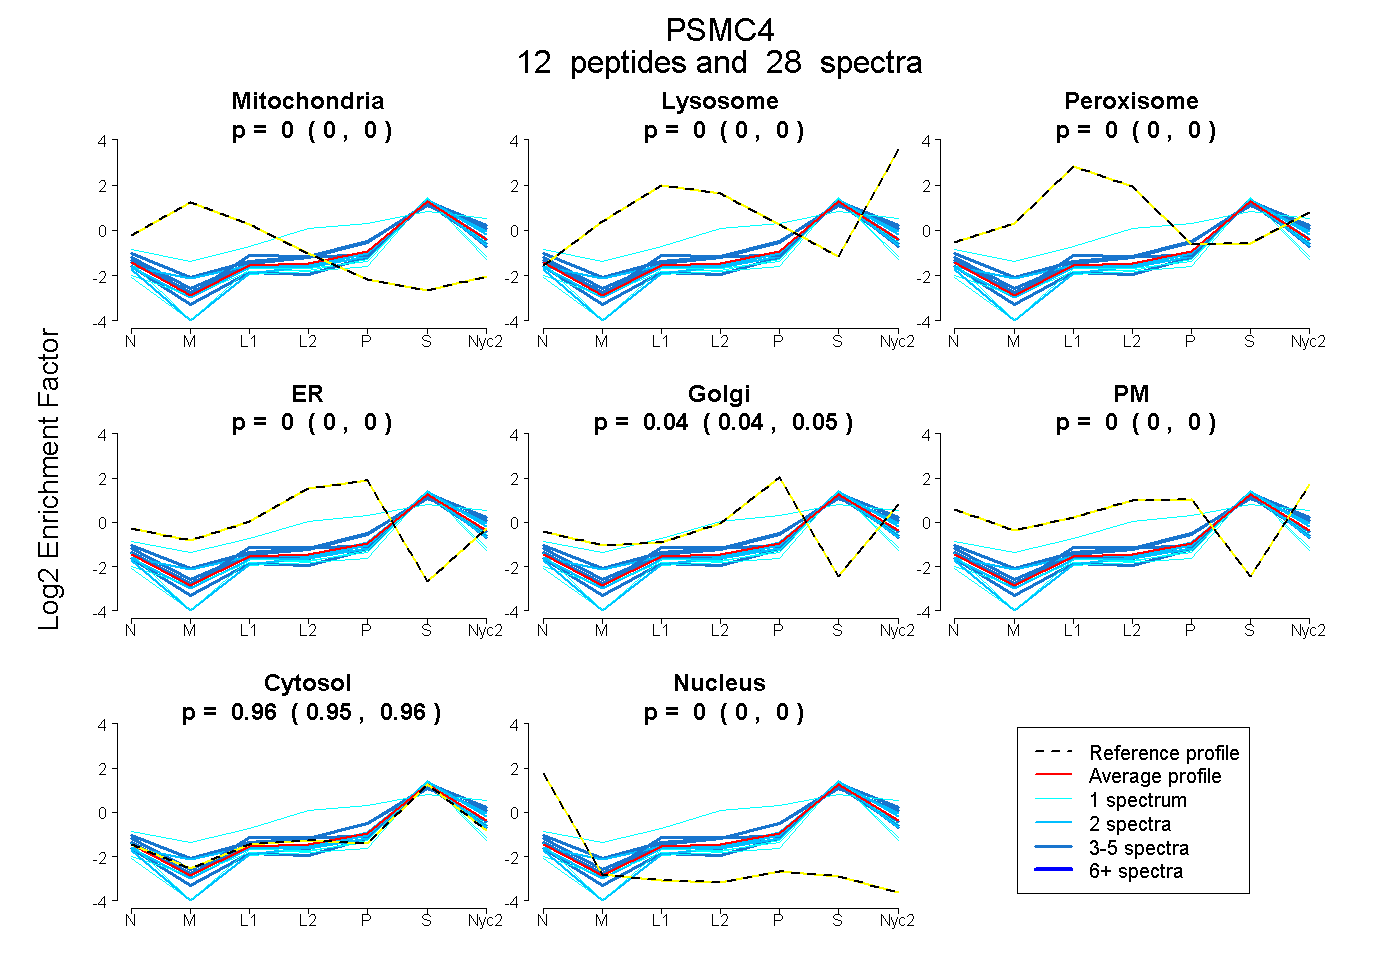
| Expt A |
12 peptides |
28 spectra |
|
0.000 0.000 | 0.000 |
0.000 0.000 | 0.000 |
0.000 0.000 | 0.000 |
0.000 0.000 | 0.000 |
0.044 0.038 | 0.050 |
0.000 0.000 | 0.000 |
0.956 0.949 | 0.961 |
0.000 0.000 | 0.000 |
| 4 spectra, EAVELPLTHFELYK | 0.000 | 0.000 | 0.000 | 0.000 | 0.000 | 0.000 | 0.987 | 0.013 | ||
| 1 spectrum, MNLSEEVDLEDYVARPDK | 0.000 | 0.000 | 0.000 | 0.000 | 0.000 | 0.000 | 1.000 | 0.000 | ||
| 1 spectrum, YIVLAK | 0.000 | 0.000 | 0.000 | 0.000 | 0.000 | 0.000 | 0.955 | 0.045 | ||
| 1 spectrum, QIGIDPPR | 0.000 | 0.222 | 0.000 | 0.064 | 0.130 | 0.015 | 0.570 | 0.000 | ||
| 1 spectrum, ISGADINSICQESGMLAVR | 0.000 | 0.000 | 0.000 | 0.000 | 0.000 | 0.000 | 0.977 | 0.023 | ||
| 2 spectra, VVGSEFVQK | 0.000 | 0.000 | 0.000 | 0.000 | 0.000 | 0.000 | 1.000 | 0.000 | ||
| 4 spectra, FDAQTGADR | 0.000 | 0.064 | 0.000 | 0.000 | 0.131 | 0.000 | 0.805 | 0.000 | ||
| 2 spectra, GVLMYGPPGCGK | 0.000 | 0.000 | 0.000 | 0.000 | 0.000 | 0.000 | 1.000 | 0.000 | ||
| 3 spectra, LIFSTITSK | 0.000 | 0.099 | 0.000 | 0.000 | 0.000 | 0.000 | 0.901 | 0.000 | ||
| 2 spectra, ILSTIDR | 0.000 | 0.053 | 0.000 | 0.000 | 0.037 | 0.000 | 0.910 | 0.000 | ||
| 4 spectra, ADTLDPALLRPGR | 0.000 | 0.000 | 0.000 | 0.000 | 0.037 | 0.000 | 0.963 | 0.000 | ||
| 3 spectra, EFLHAQEEVK | 0.000 | 0.000 | 0.000 | 0.000 | 0.120 | 0.000 | 0.880 | 0.000 |
| Plot | Mito | Lyso or Perox | ER | Golgi | PM | Cytosol | Nucleus | ||||||
| Expt B |
3 peptides |
4 spectra |
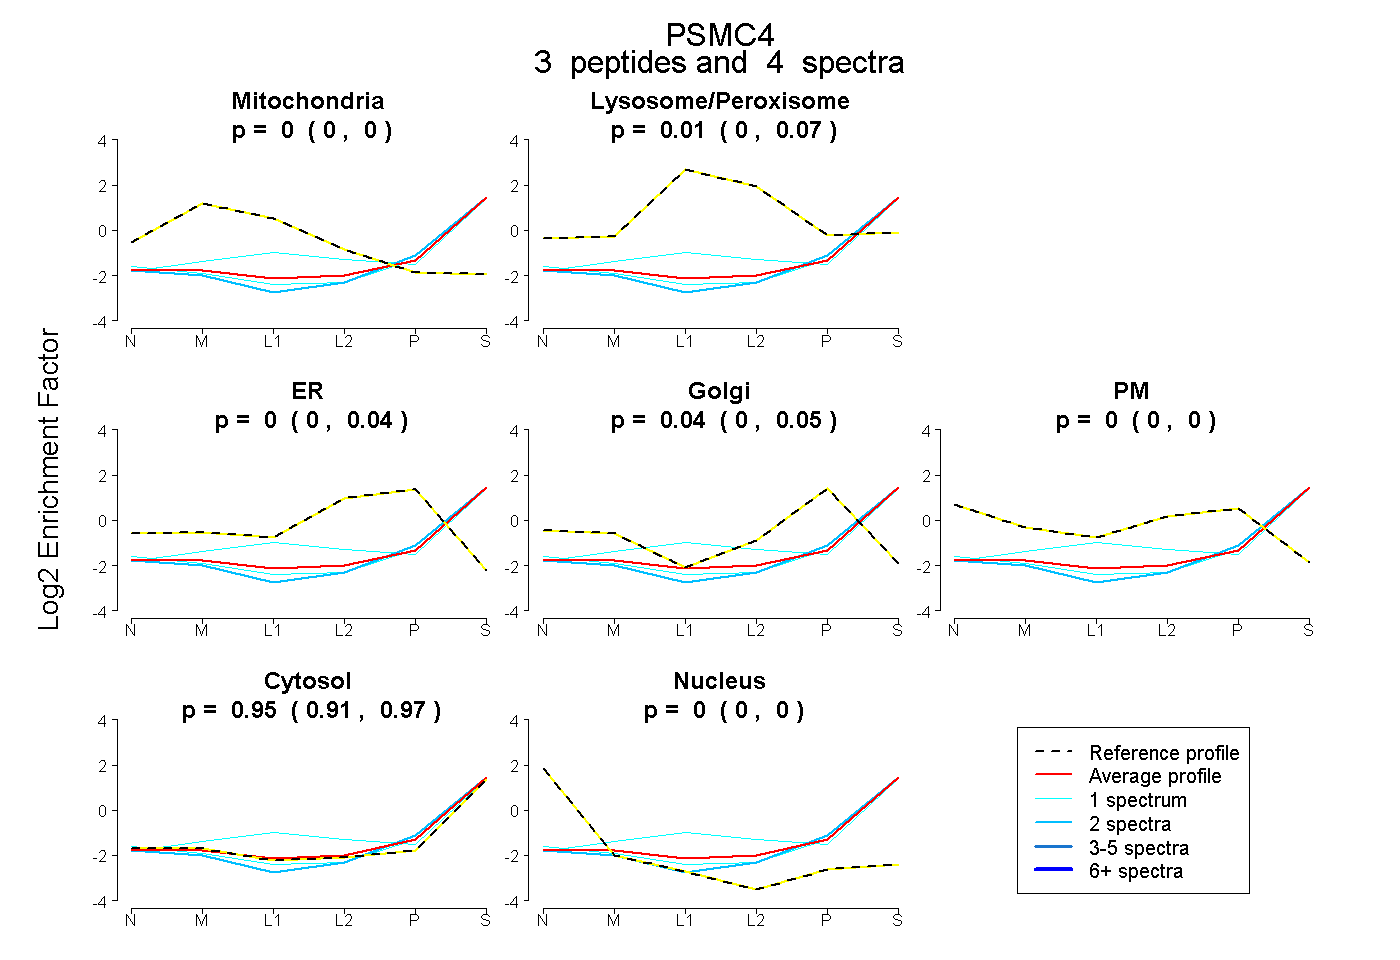 |
0.000 0.000 | 0.000 |
0.013 0.000 | 0.075 |
0.000 0.000 | 0.045 |
0.038 0.000 | 0.054 |
0.000 0.000 | 0.000 |
0.949 0.910 | 0.971 |
0.000 0.000 | 0.000 |
|||
| Plot | Lyso | Other | |||||||||||
| Expt C |
12 peptides |
57 spectra |
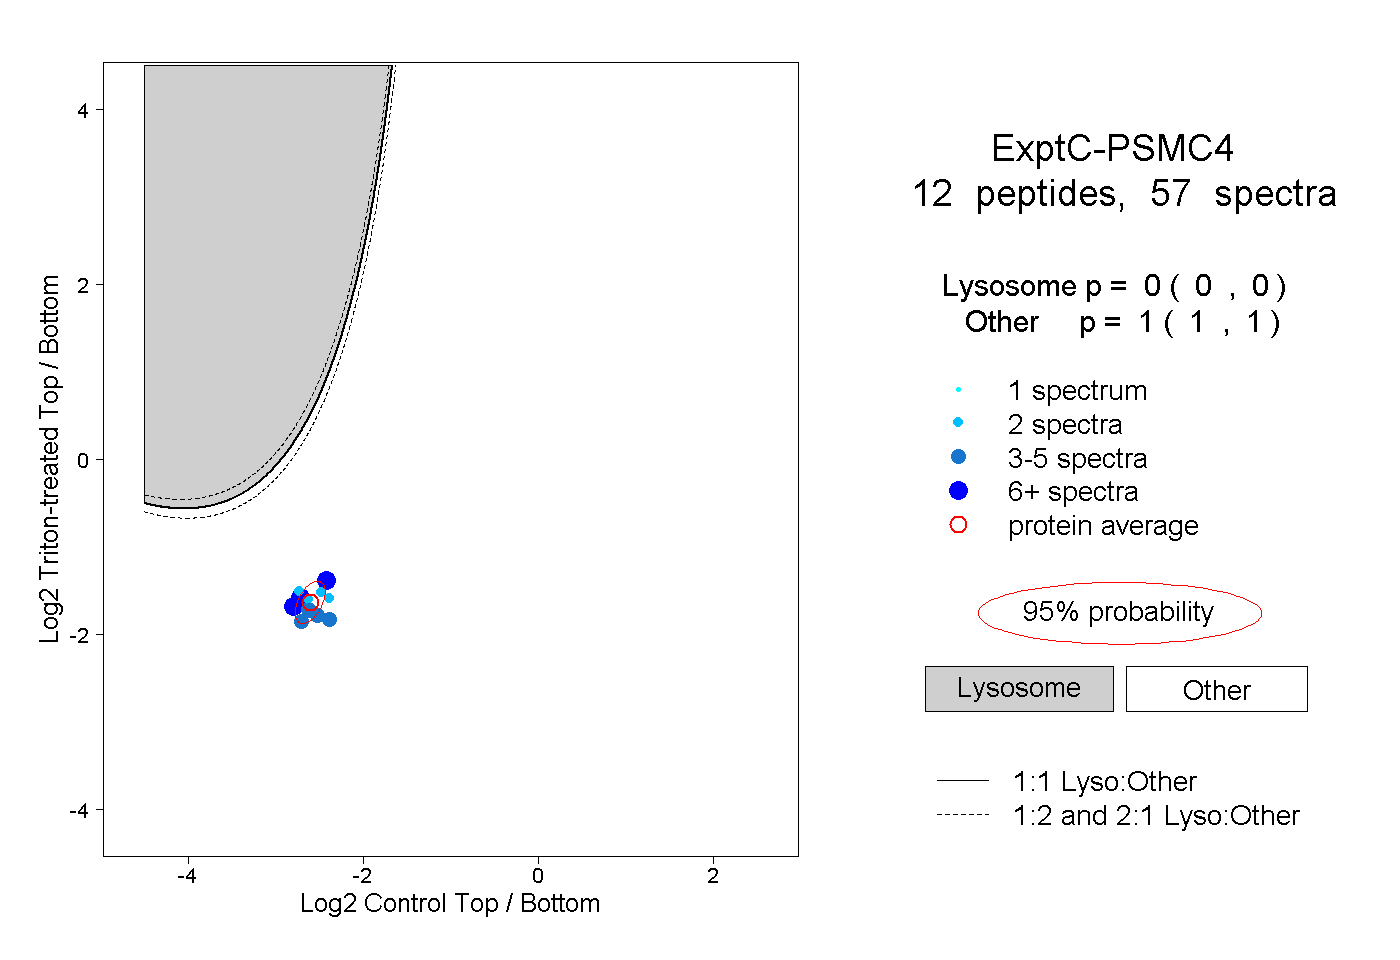 |
0.000 0.000 | 0.000 |
1.000 1.000 | 1.000 |
||||||||
| Plot | Lyso | Other | |||||||||||
| Expt D |
1 peptide |
1 spectrum |
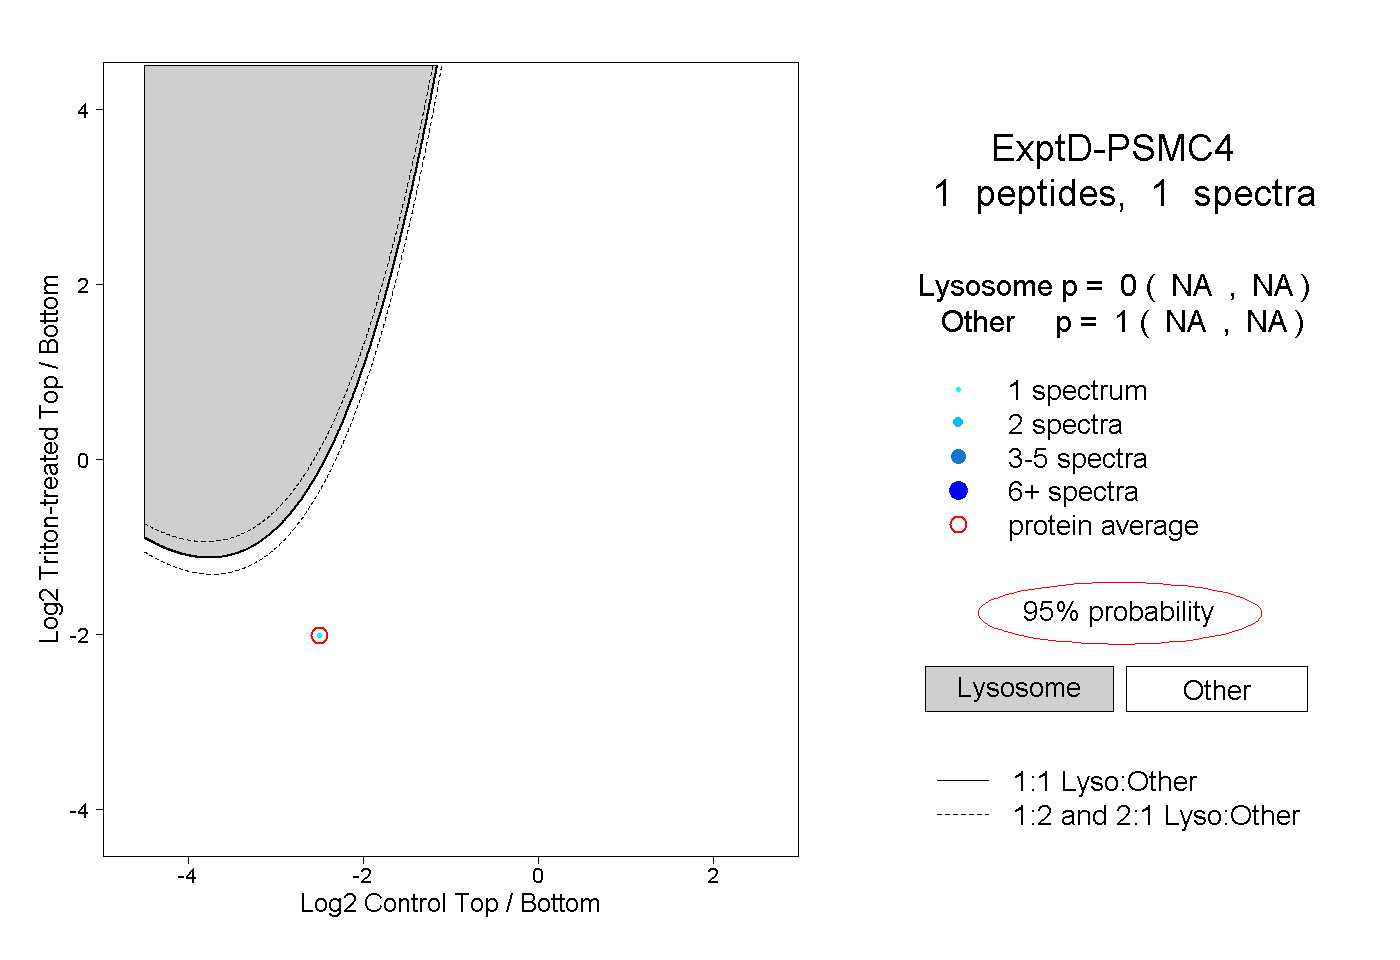 |
0.000 NA | NA |
1.000 NA | NA |