 4
4peptides
spectra
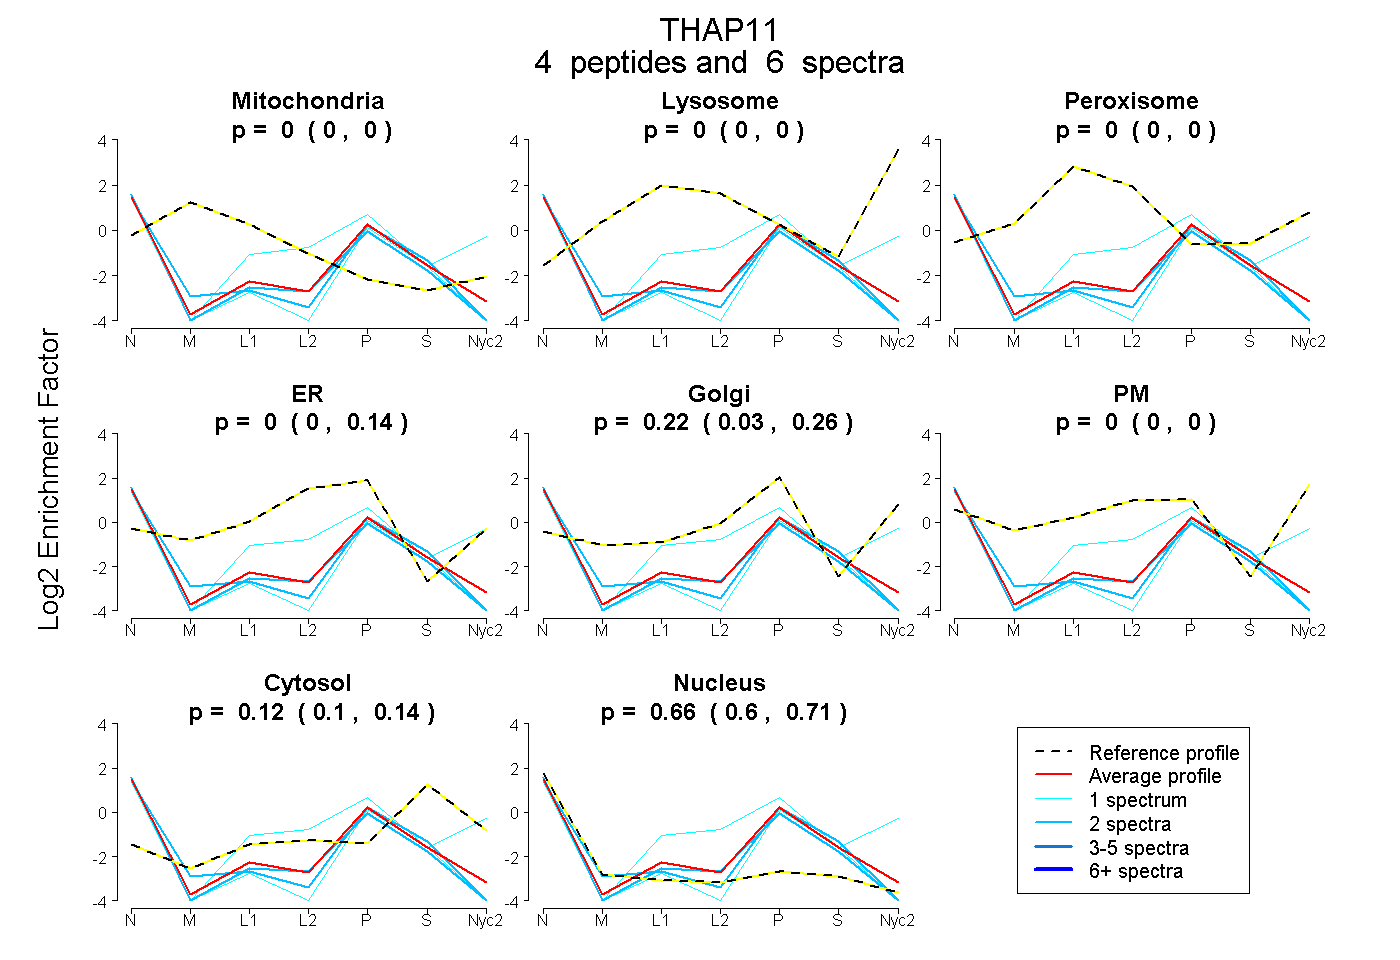
0.000 | 0.000
0.000 | 0.000
0.000 | 0.000
0.000 | 0.137
0.032 | 0.257
0.000 | 0.000
0.102 | 0.139
0.605 | 0.710
| Plot | Mito | Lyso | Perox | ER | Golgi | PM | Cytosol | Nucleus | |||||
| Expt A |
4 peptides |
6 spectra |
|
0.000 0.000 | 0.000 |
0.000 0.000 | 0.000 |
0.000 0.000 | 0.000 |
0.000 0.000 | 0.137 |
0.218 0.032 | 0.257 |
0.000 0.000 | 0.000 |
0.122 0.102 | 0.139 |
0.661 0.605 | 0.710 |
| 1 spectrum, ALHFYTFPK | 0.000 | 0.000 | 0.000 | 0.000 | 0.413 | 0.135 | 0.165 | 0.287 | ||
| 2 spectra, VPTIFPLR | 0.000 | 0.000 | 0.000 | 0.114 | 0.012 | 0.000 | 0.099 | 0.775 | ||
| 1 spectrum, LLAMAVIR | 0.000 | 0.000 | 0.000 | 0.000 | 0.069 | 0.000 | 0.108 | 0.824 | ||
| 2 spectra, DILALMEVK | 0.000 | 0.000 | 0.000 | 0.000 | 0.133 | 0.000 | 0.129 | 0.739 |