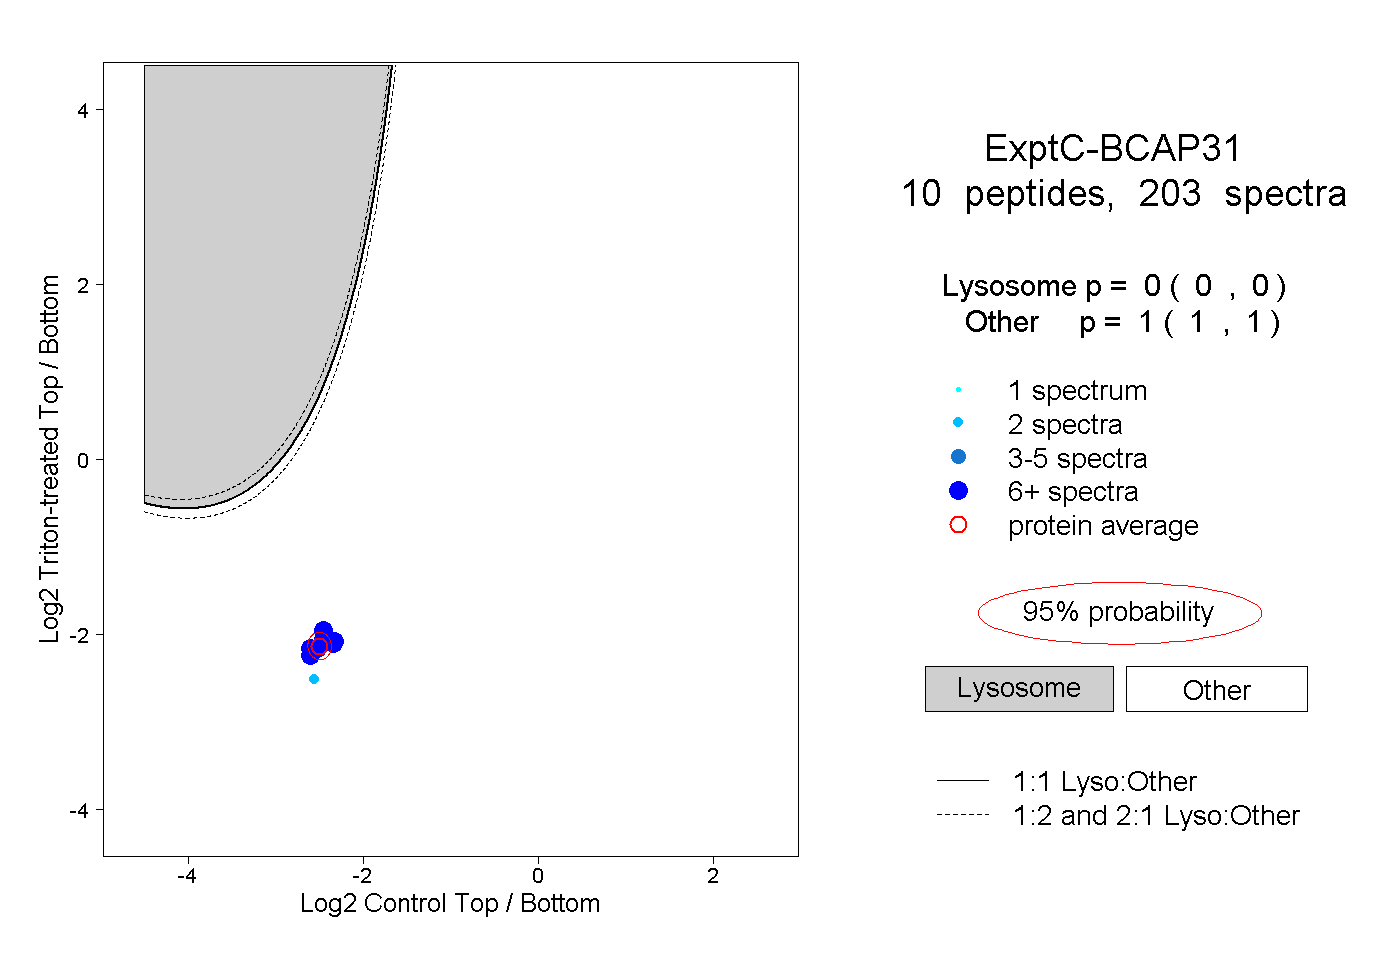
10
10peptides
spectra
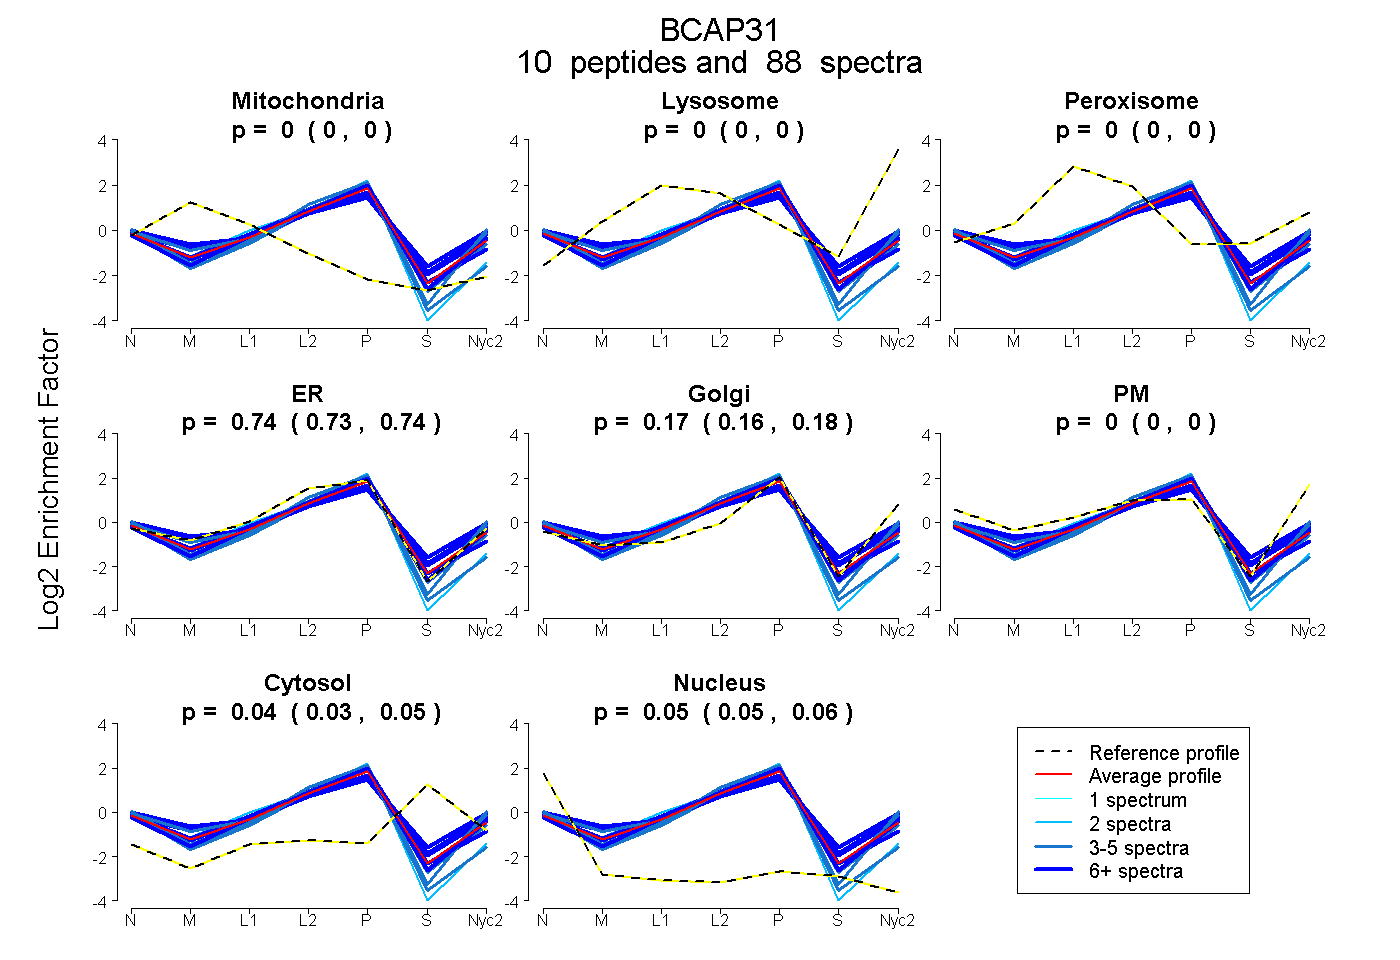
0.000 | 0.000
0.000 | 0.000
0.000 | 0.000
0.729 | 0.744
0.157 | 0.176
0.000 | 0.000
0.034 | 0.047
0.050 | 0.058
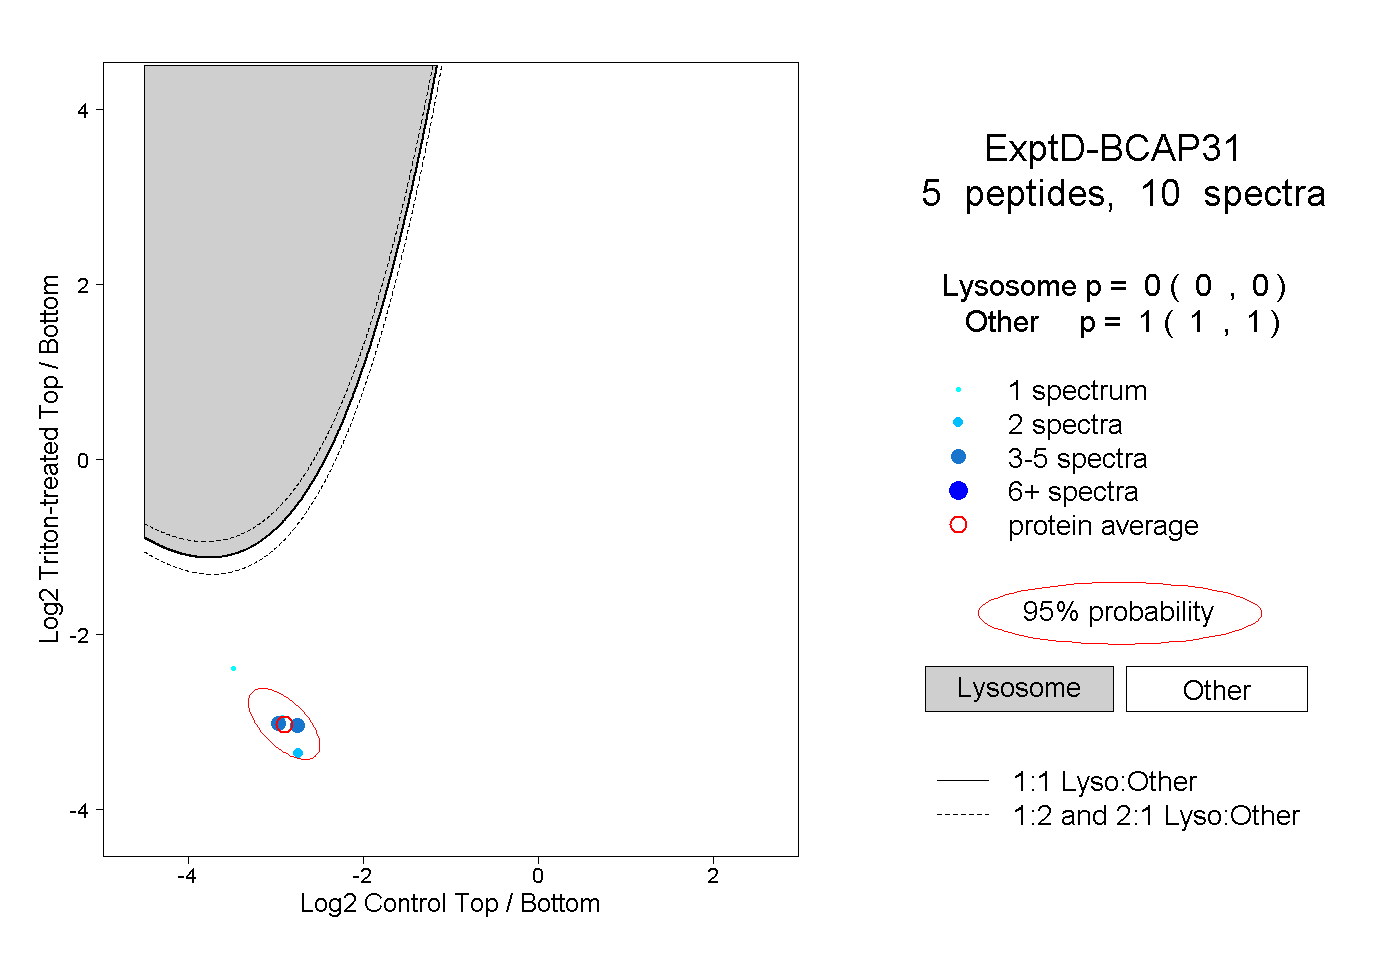
6peptides
spectra
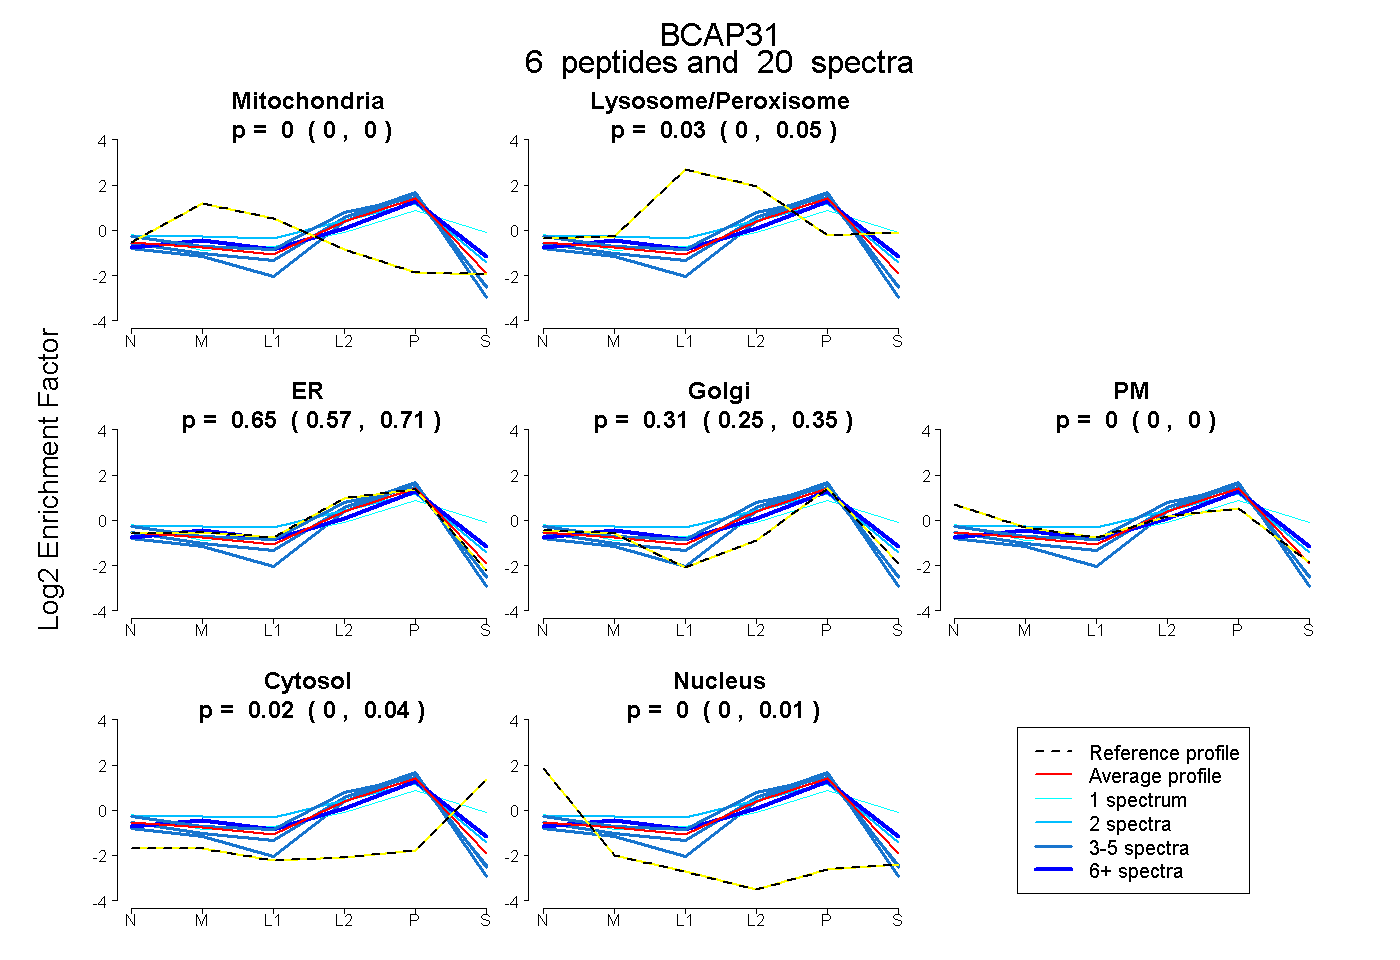
0.000 | 0.000
0.000 | 0.054
0.574 | 0.707
0.254 | 0.351
0.000 | 0.000
0.000 | 0.035
0.000 | 0.005