 10
10peptides
spectra
0.000 | 0.000
0.000 | 0.000
0.000 | 0.000
0.729 | 0.744
0.157 | 0.176
0.000 | 0.000
0.034 | 0.047
0.050 | 0.058
| Plot | Mito | Lyso | Perox | ER | Golgi | PM | Cytosol | Nucleus | |||||
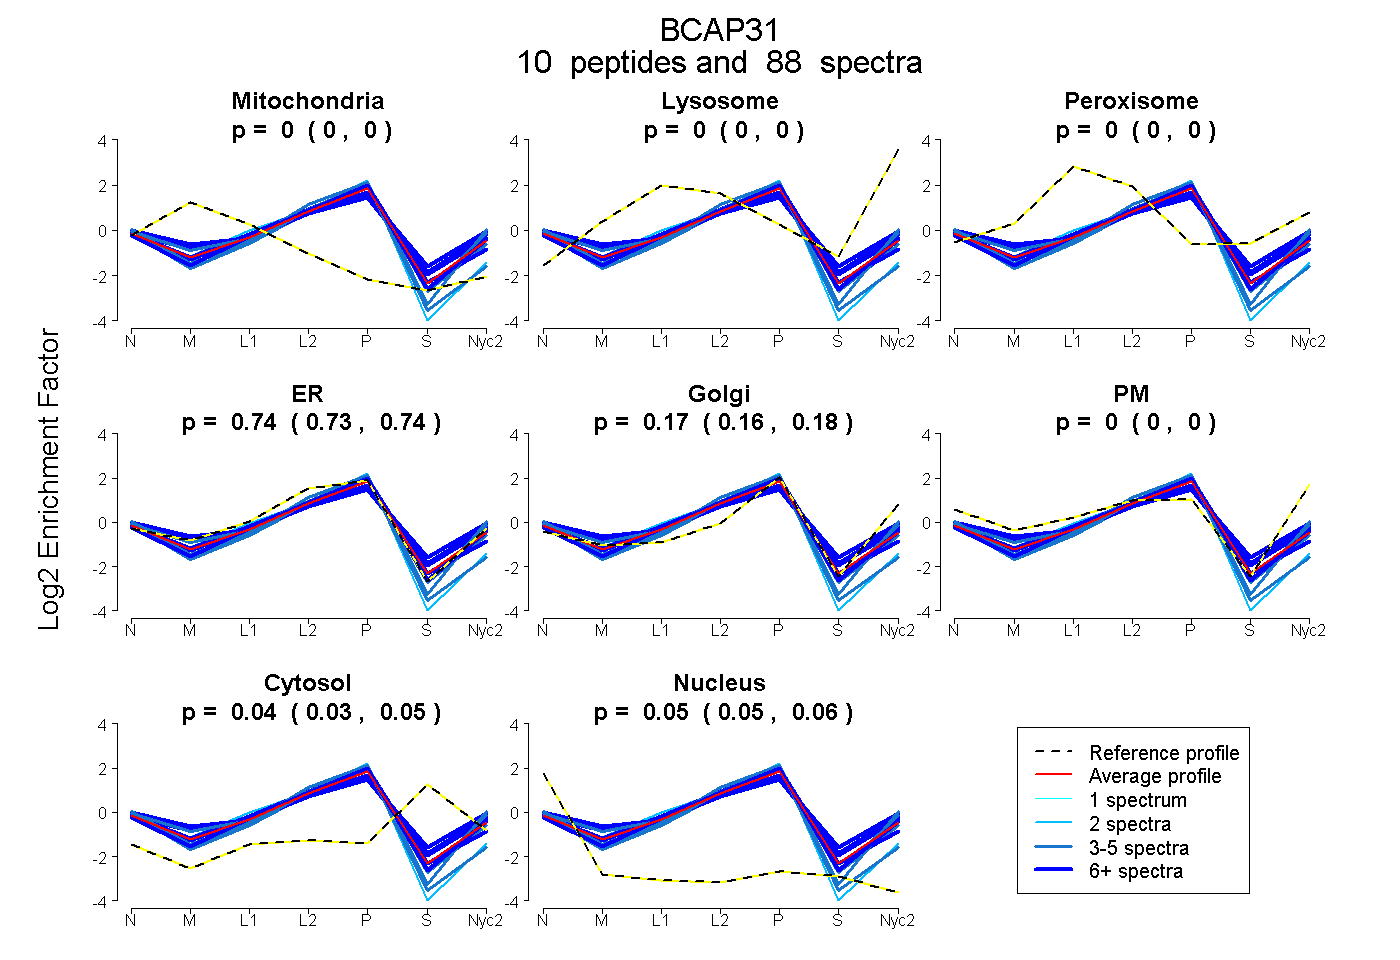
| Expt A |
10 peptides |
88 spectra |
|
0.000 0.000 | 0.000 |
0.000 0.000 | 0.000 |
0.000 0.000 | 0.000 |
0.737 0.729 | 0.744 |
0.168 0.157 | 0.176 |
0.000 0.000 | 0.000 |
0.041 0.034 | 0.047 |
0.054 0.050 | 0.058 |
| 4 spectra, VNLQNNPGAMEHFHMK | 0.000 | 0.000 | 0.000 | 0.694 | 0.285 | 0.000 | 0.000 | 0.021 | ||
| 9 spectra, LLEEHAK | 0.000 | 0.000 | 0.000 | 0.877 | 0.019 | 0.000 | 0.036 | 0.068 | ||
| 5 spectra, GTAEDGGK | 0.000 | 0.000 | 0.000 | 0.693 | 0.208 | 0.000 | 0.000 | 0.099 | ||
| 29 spectra, AENEALAMQK | 0.000 | 0.000 | 0.000 | 0.693 | 0.161 | 0.000 | 0.124 | 0.022 | ||
| 3 spectra, QSEGLTK | 0.000 | 0.000 | 0.000 | 0.878 | 0.000 | 0.000 | 0.000 | 0.122 | ||
| 15 spectra, YMEENDQLK | 0.000 | 0.000 | 0.000 | 0.724 | 0.212 | 0.000 | 0.002 | 0.062 | ||
| 2 spectra, GPSDK | 0.000 | 0.000 | 0.000 | 0.900 | 0.000 | 0.000 | 0.000 | 0.100 | ||
| 11 spectra, QAESASEAAK | 0.000 | 0.000 | 0.032 | 0.573 | 0.166 | 0.081 | 0.147 | 0.000 | ||
| 4 spectra, YDDVTEK | 0.000 | 0.000 | 0.000 | 0.624 | 0.326 | 0.000 | 0.000 | 0.051 | ||
| 6 spectra, LDVGSPEMK | 0.046 | 0.000 | 0.000 | 0.561 | 0.168 | 0.109 | 0.110 | 0.006 |
| Plot | Mito | Lyso or Perox | ER | Golgi | PM | Cytosol | Nucleus | ||||||
| Expt B |
6 peptides |
20 spectra |
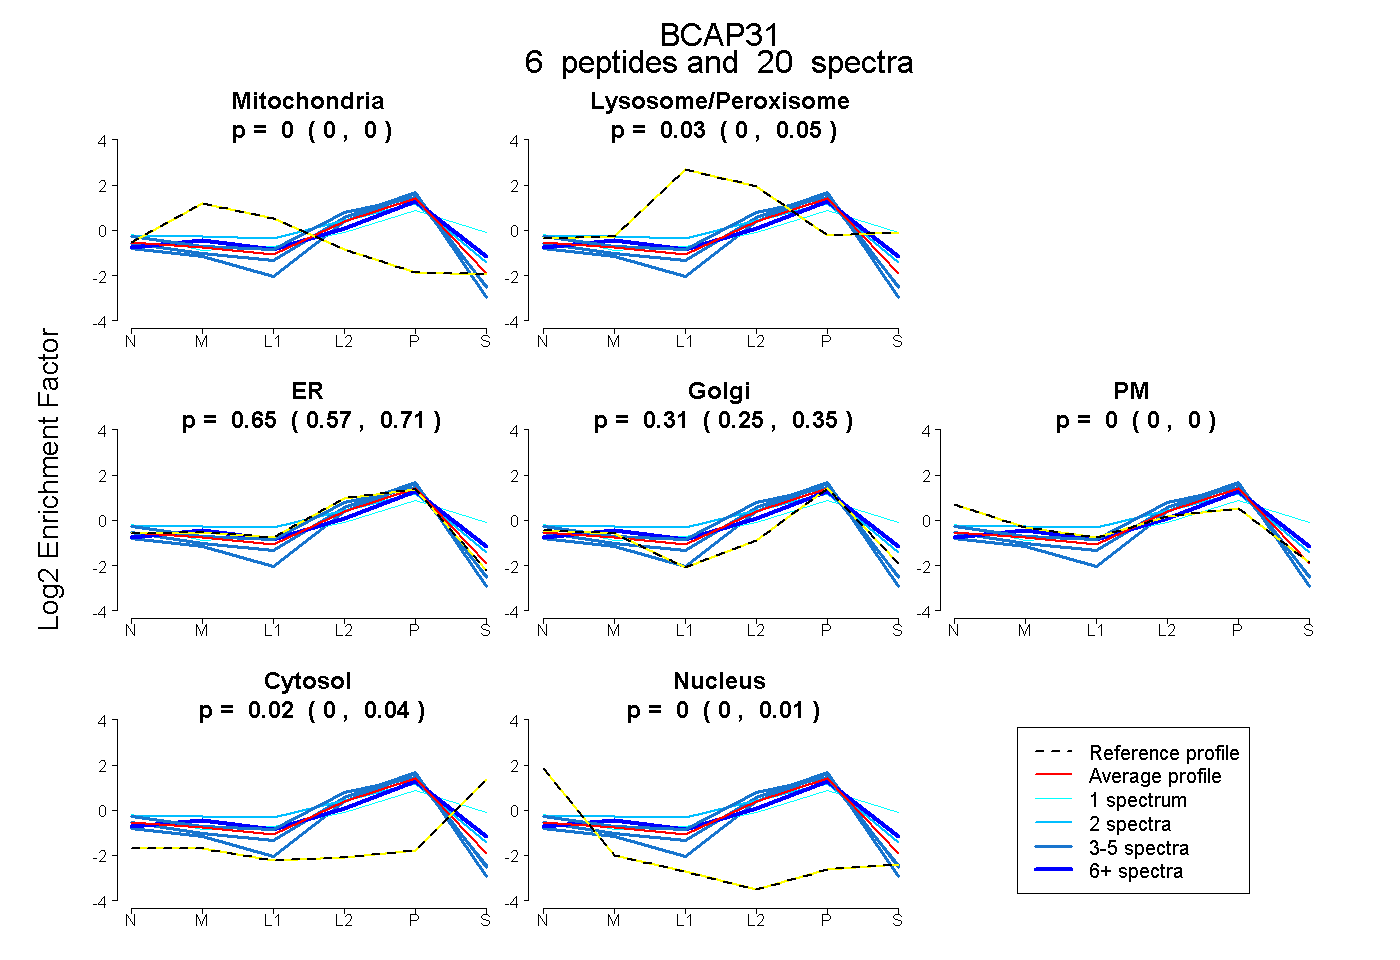 |
0.000 0.000 | 0.000 |
0.025 0.000 | 0.054 |
0.650 0.574 | 0.707 |
0.306 0.254 | 0.351 |
0.000 0.000 | 0.000 |
0.018 0.000 | 0.035 |
0.000 0.000 | 0.005 |
|||
| Plot | Lyso | Other | |||||||||||
| Expt C |
10 peptides |
203 spectra |
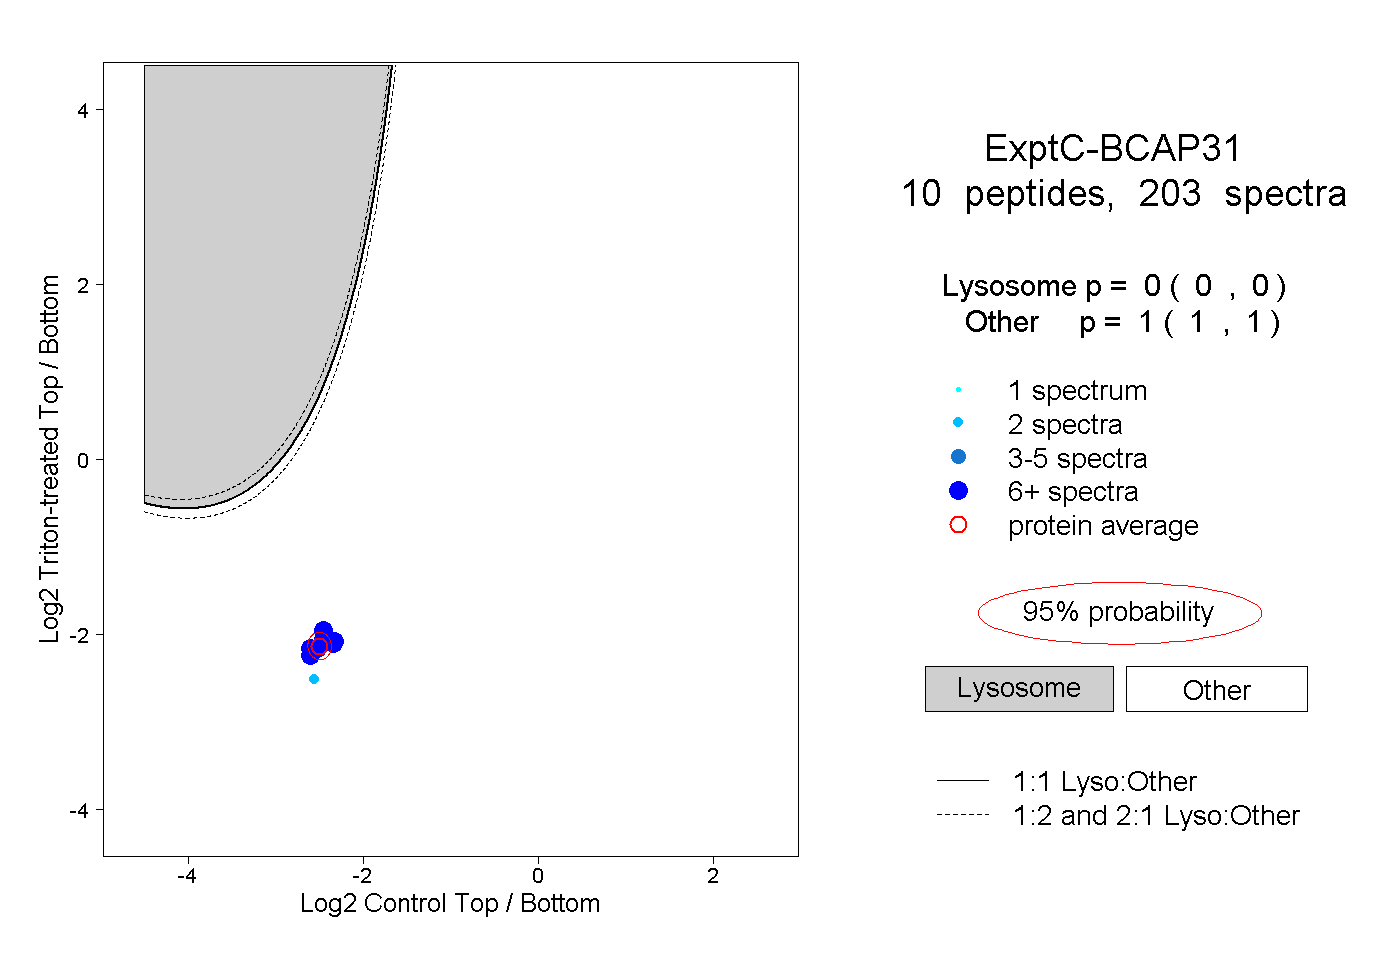 |
0.000 0.000 | 0.000 |
1.000 1.000 | 1.000 |
||||||||
| Plot | Lyso | Other | |||||||||||
| Expt D |
5 peptides |
10 spectra |
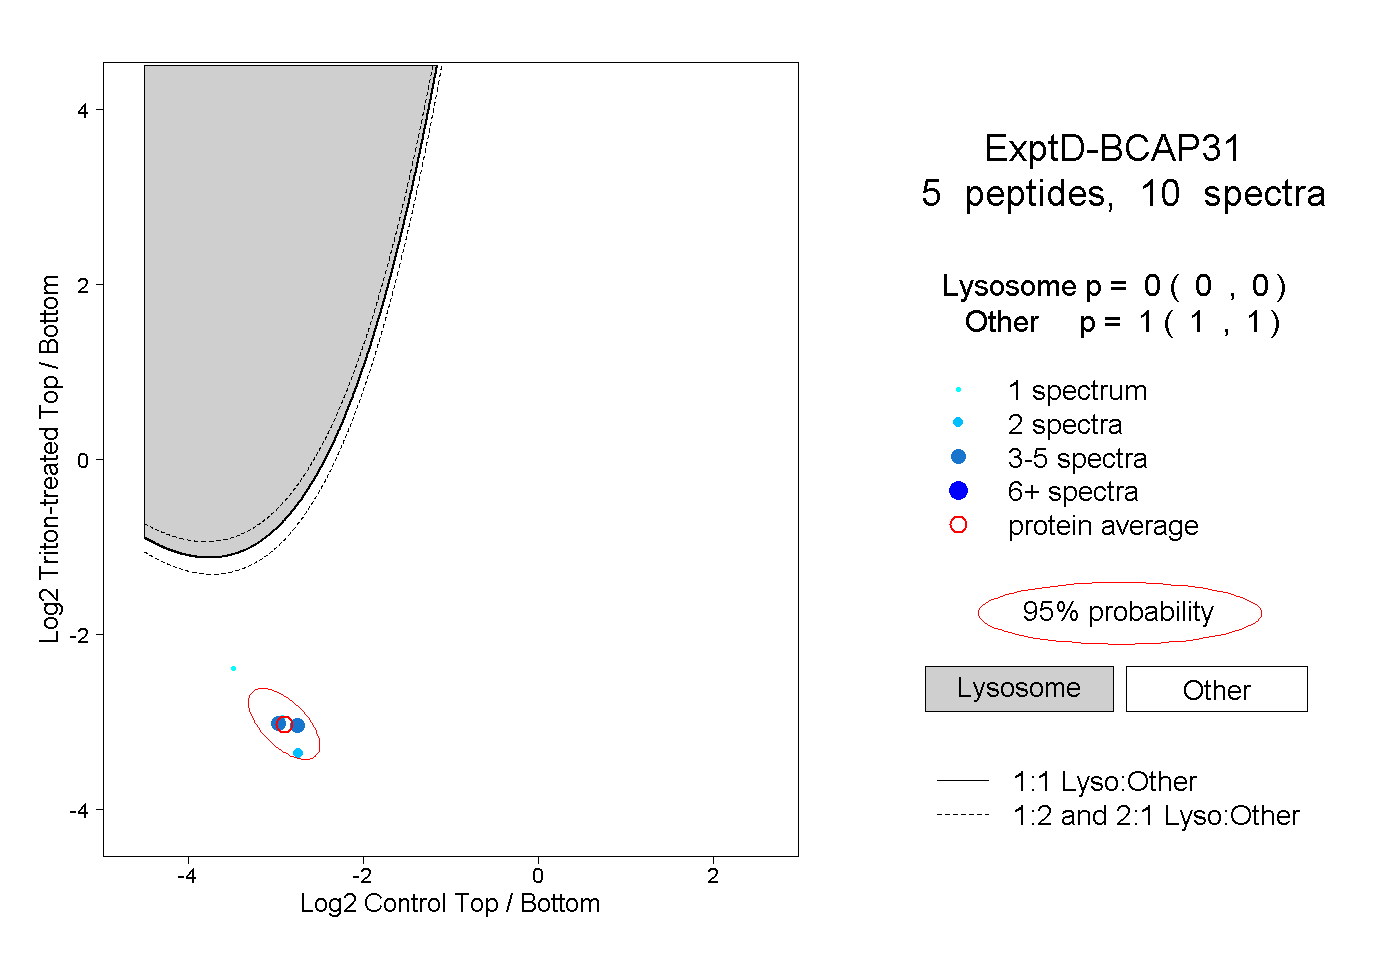 |
0.000 0.000 | 0.000 |
1.000 1.000 | 1.000 |