 4
4peptides
spectra
0.000 | 0.000
0.050 | 0.090
0.056 | 0.106
0.090 | 0.148
0.000 | 0.013
0.515 | 0.576
0.160 | 0.185
0.000 | 0.000
5peptides
spectra
0.000 | 0.000
1.000 | 1.000
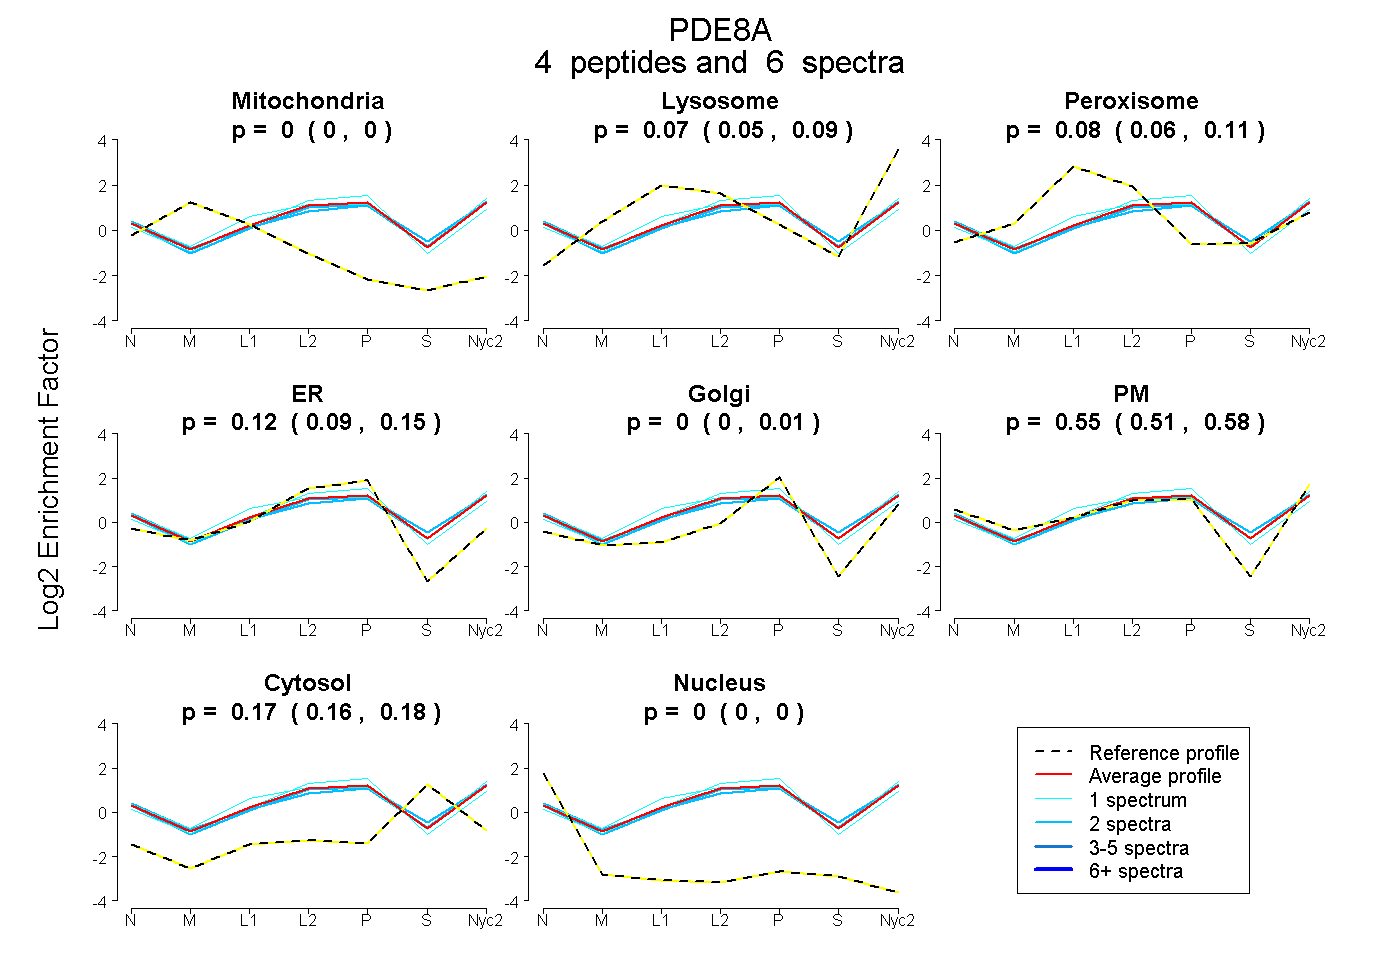
| Plot | Mito | Lyso | Perox | ER | Golgi | PM | Cytosol | Nucleus | |||||
| Expt A |
4 peptides |
6 spectra |
|
0.000 0.000 | 0.000 |
0.071 0.050 | 0.090 |
0.083 0.056 | 0.106 |
0.122 0.090 | 0.148 |
0.000 0.000 | 0.013 |
0.550 0.515 | 0.576 |
0.174 0.160 | 0.185 |
0.000 0.000 | 0.000 |
||
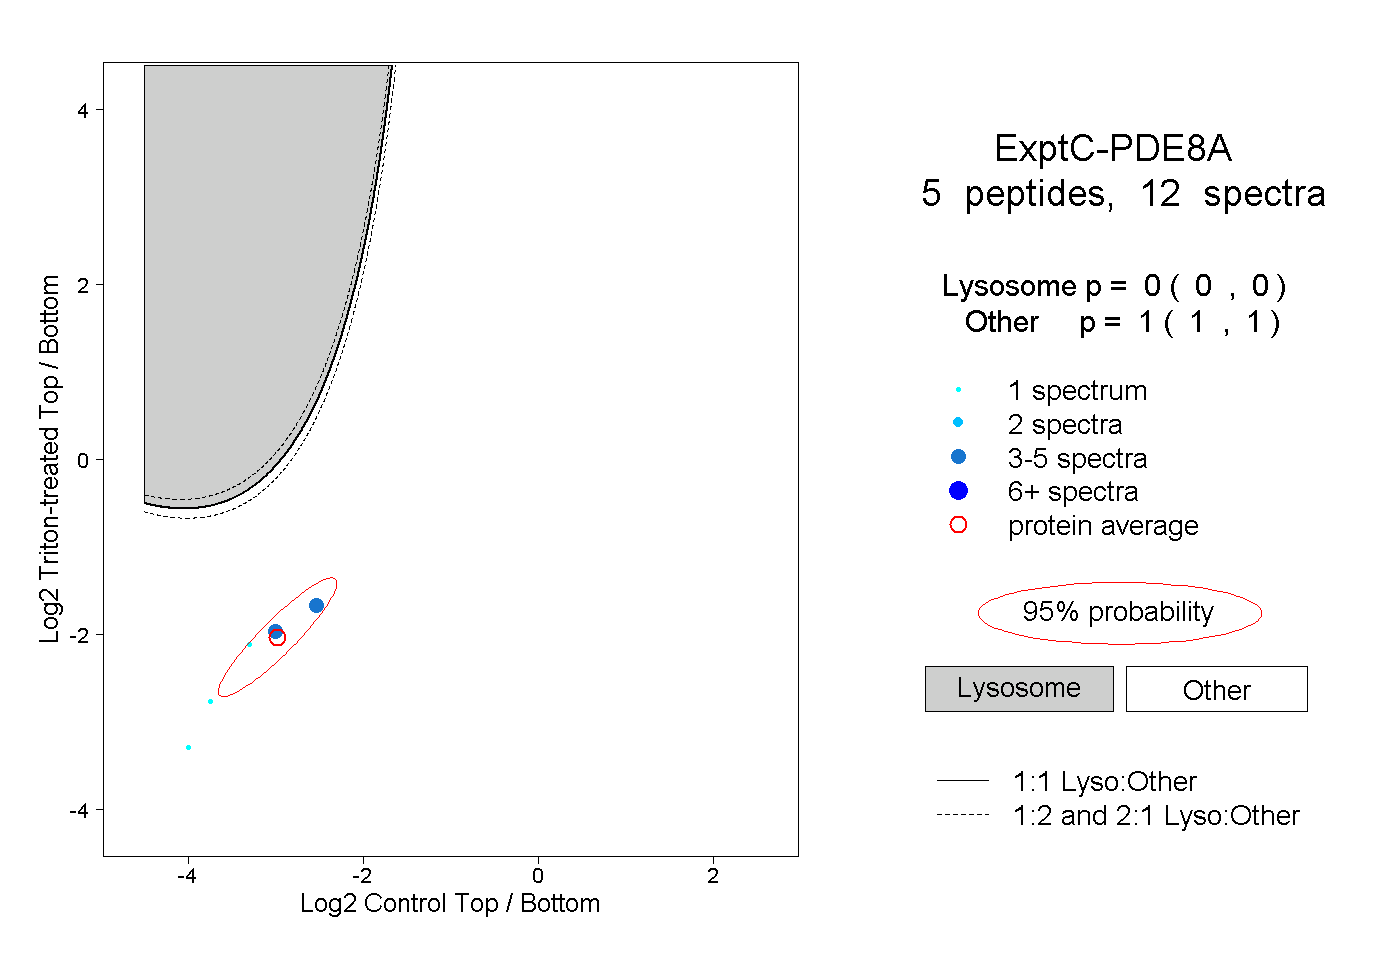
| Plot | Lyso | Other | |||||||||||
| Expt C |
5 peptides |
12 spectra |
|
0.000 0.000 | 0.000 |
1.000 1.000 | 1.000 |