6
6peptides
spectra
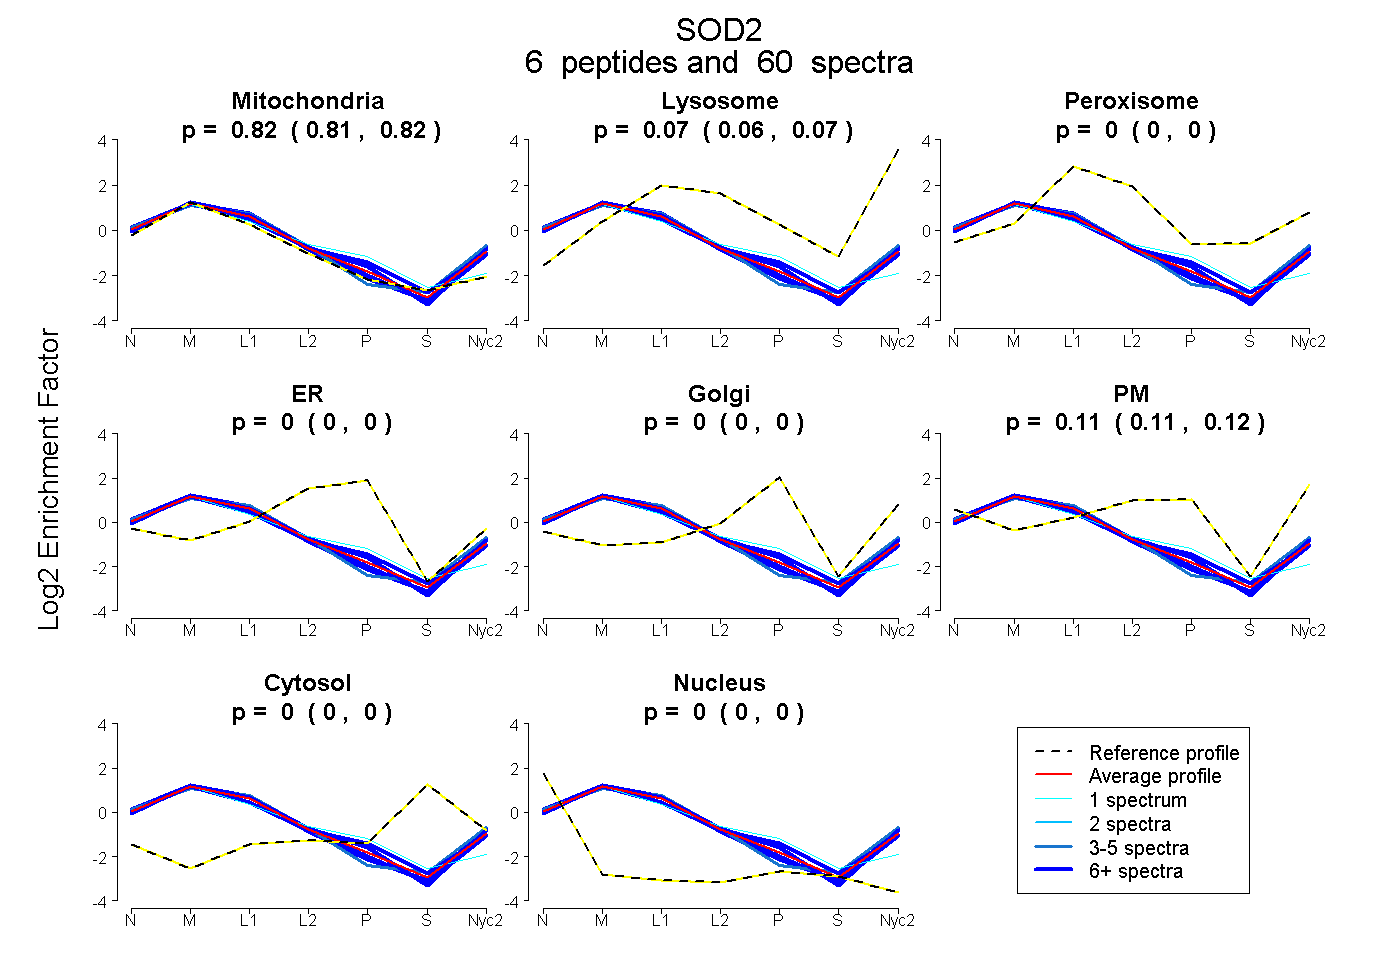
0.813 | 0.823
0.061 | 0.072
0.000 | 0.000
0.000 | 0.000
0.000 | 0.000
0.106 | 0.122
0.000 | 0.000
0.000 | 0.000
8peptides
spectra
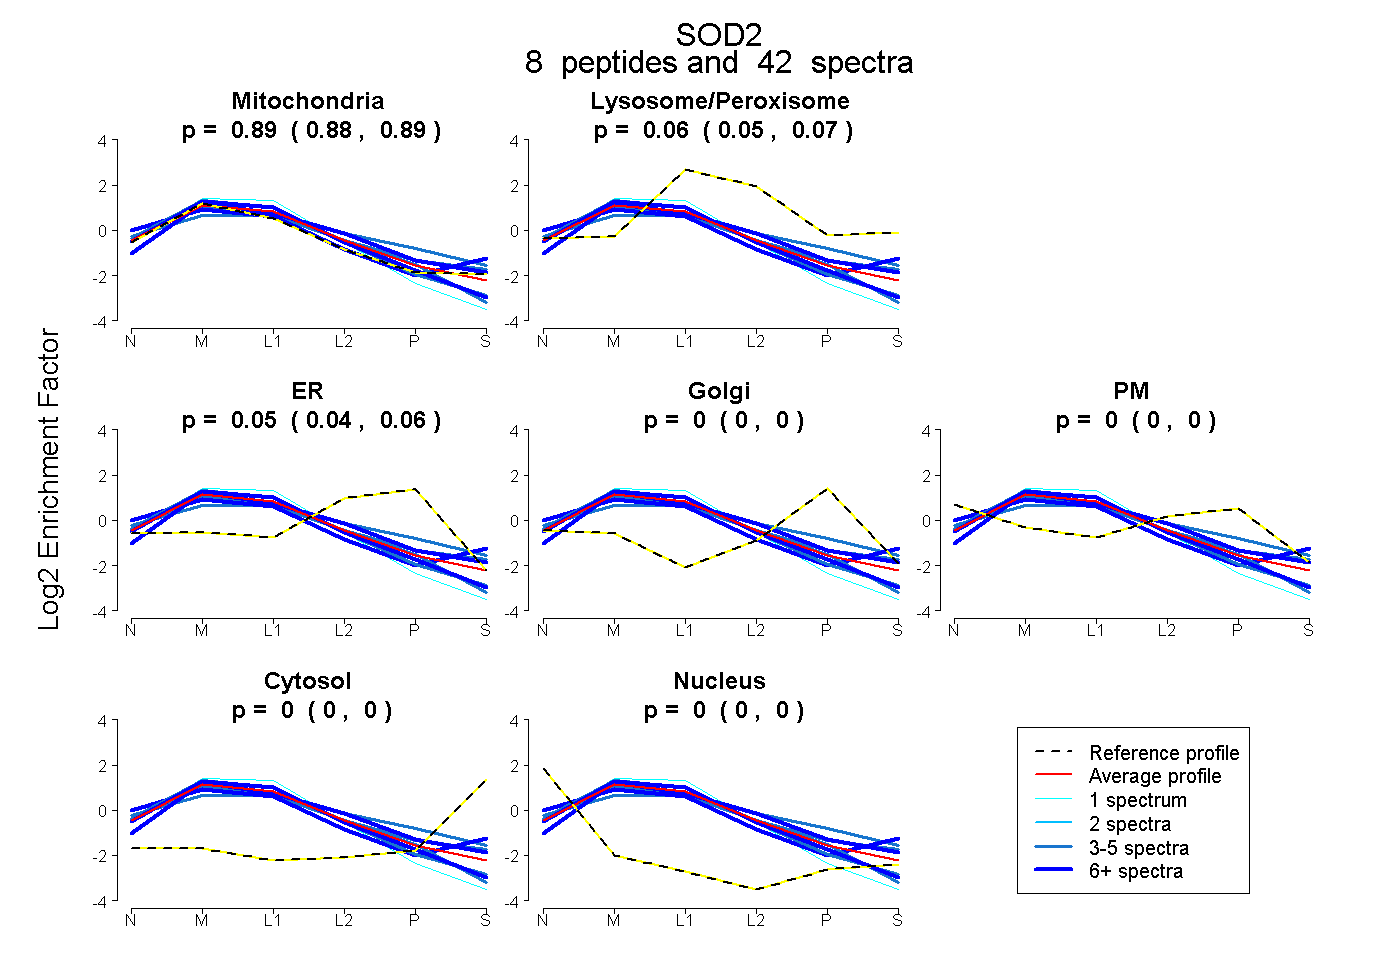
0.875 | 0.894
0.052 | 0.073
0.038 | 0.062
0.000 | 0.000
0.000 | 0.000
0.000 | 0.000
0.000 | 0.000
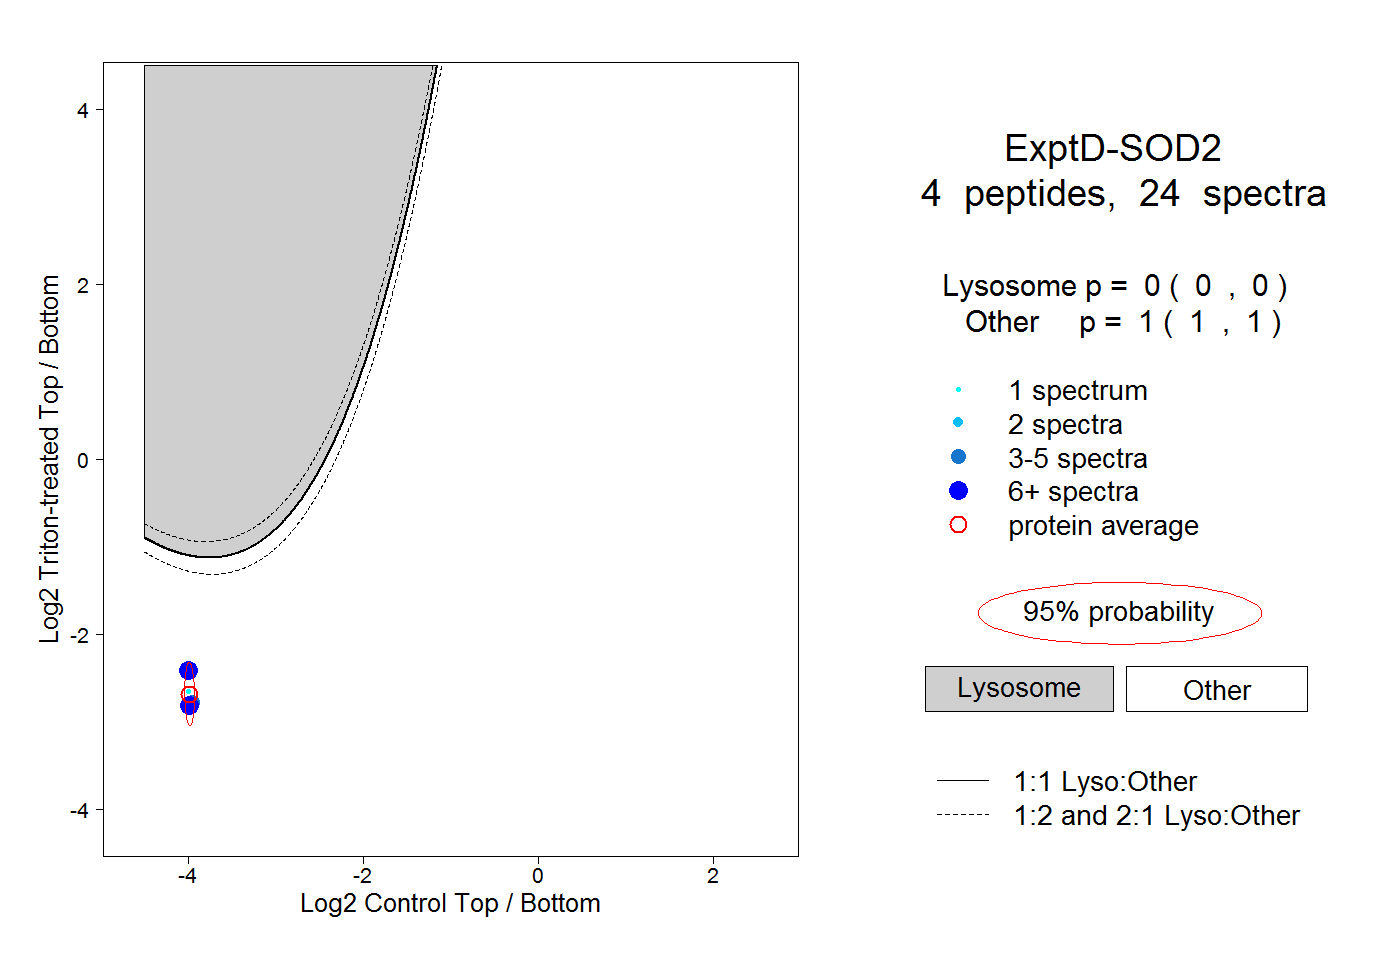
8peptides
spectra
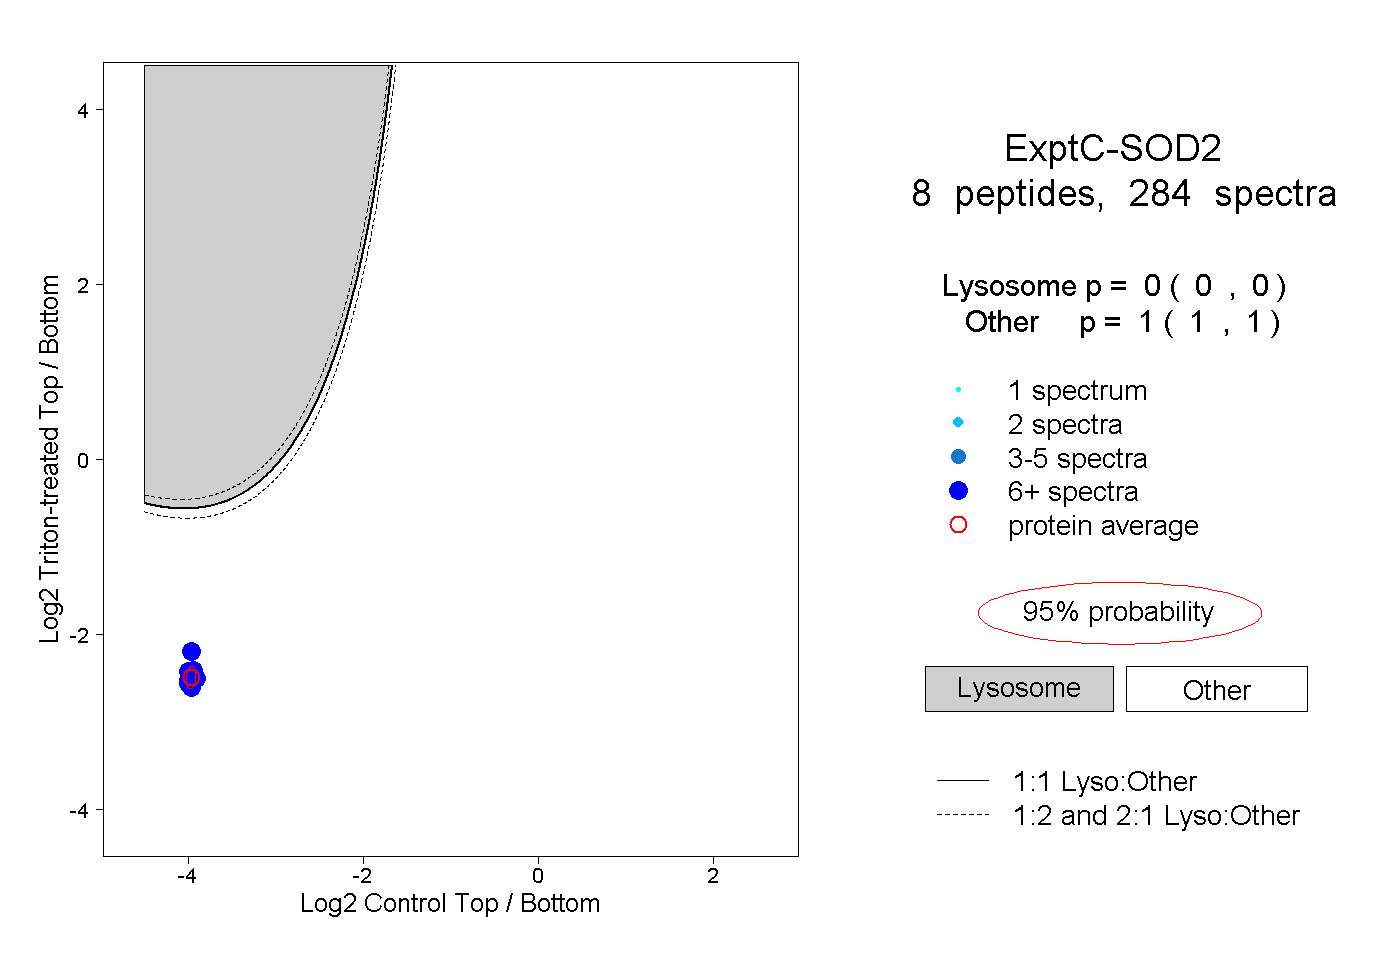
0.000 | 0.000
1.000 | 1.000