 6
6peptides
spectra
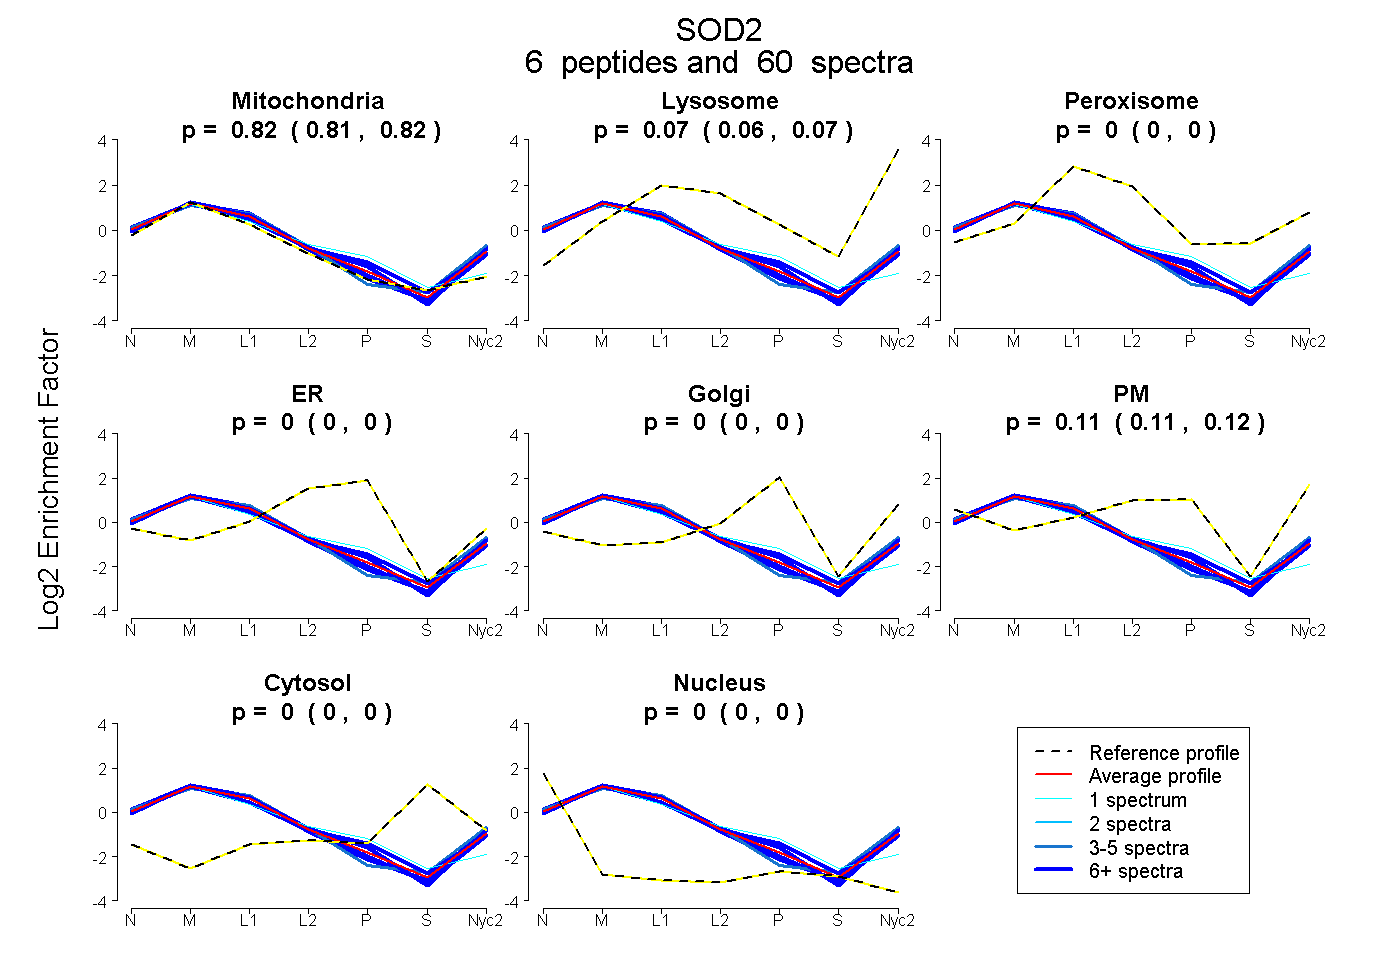
0.813 | 0.823
0.061 | 0.072
0.000 | 0.000
0.000 | 0.000
0.000 | 0.000
0.106 | 0.122
0.000 | 0.000
0.000 | 0.000
| Plot | Mito | Lyso | Perox | ER | Golgi | PM | Cytosol | Nucleus | |||||
| Expt A |
6 peptides |
60 spectra |
|
0.819 0.813 | 0.823 |
0.067 0.061 | 0.072 |
0.000 0.000 | 0.000 |
0.000 0.000 | 0.000 |
0.000 0.000 | 0.000 |
0.114 0.106 | 0.122 |
0.000 0.000 | 0.000 |
0.000 0.000 | 0.000 |
| 7 spectra, DFGSFEK | 0.843 | 0.050 | 0.000 | 0.000 | 0.000 | 0.107 | 0.000 | 0.000 | ||
| 1 spectrum, YHEALAK | 0.819 | 0.000 | 0.000 | 0.181 | 0.000 | 0.000 | 0.000 | 0.000 | ||
| 26 spectra, NVRPDYLK | 0.785 | 0.030 | 0.000 | 0.000 | 0.000 | 0.185 | 0.000 | 0.000 | ||
| 11 spectra, GELLEAIK | 0.779 | 0.041 | 0.000 | 0.000 | 0.000 | 0.180 | 0.000 | 0.000 | ||
| 10 spectra, AIWNVINWENVSQR | 0.845 | 0.117 | 0.000 | 0.000 | 0.000 | 0.038 | 0.000 | 0.000 | ||
| 5 spectra, GDVTTQVALQPALK | 0.823 | 0.163 | 0.000 | 0.000 | 0.000 | 0.000 | 0.000 | 0.013 |
| Plot | Mito | Lyso or Perox | ER | Golgi | PM | Cytosol | Nucleus | ||||||
| Expt B |
8 peptides |
42 spectra |
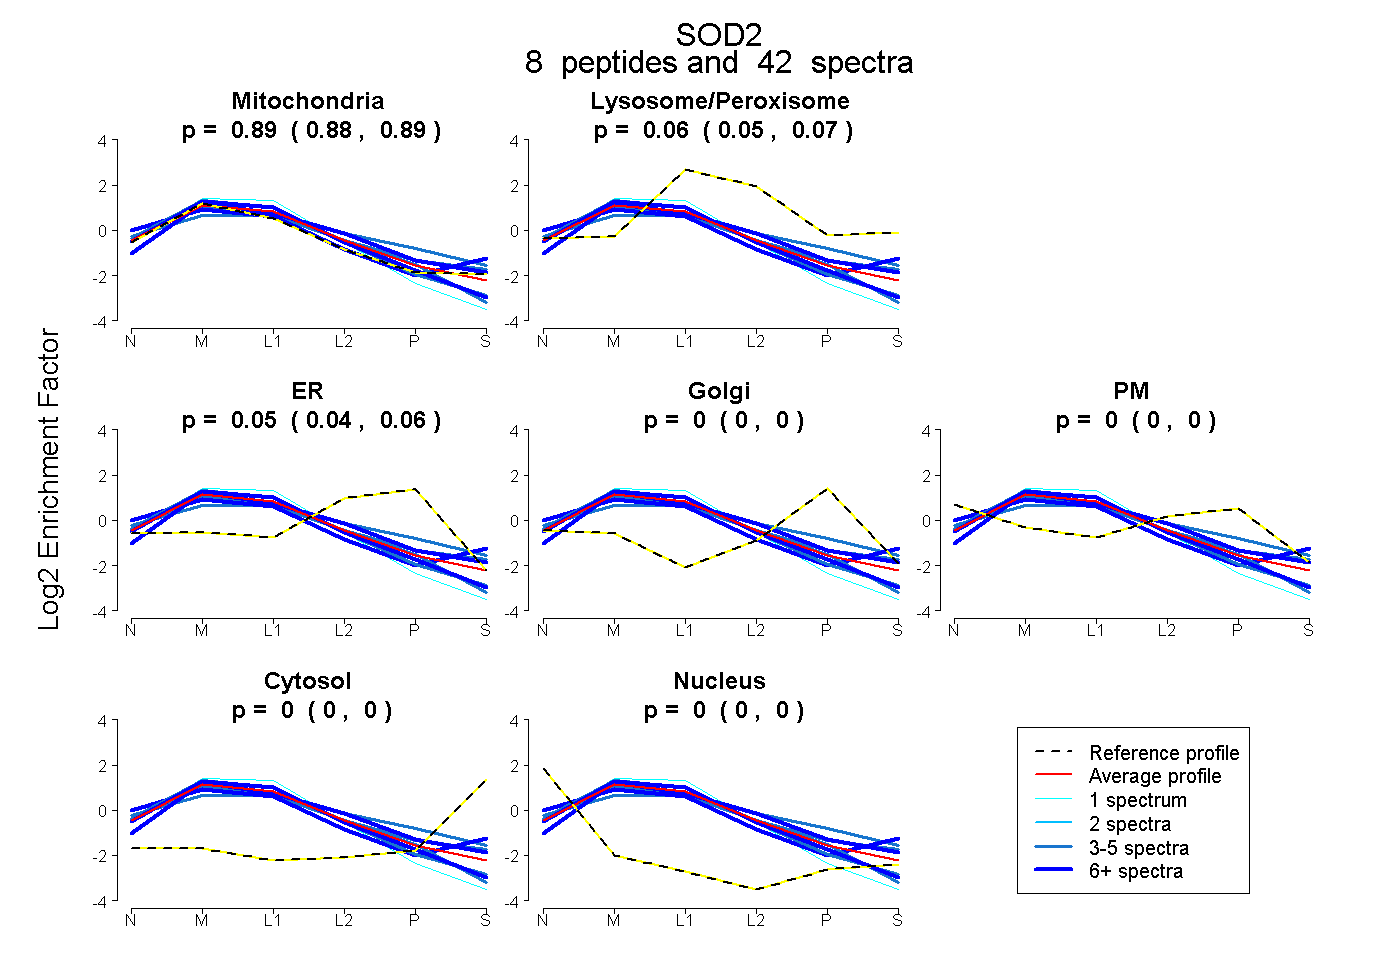 |
0.886 0.875 | 0.894 |
0.064 0.052 | 0.073 |
0.051 0.038 | 0.062 |
0.000 0.000 | 0.000 |
0.000 0.000 | 0.000 |
0.000 0.000 | 0.000 |
0.000 0.000 | 0.000 |
|||
| Plot | Lyso | Other | |||||||||||
| Expt C |
8 peptides |
284 spectra |
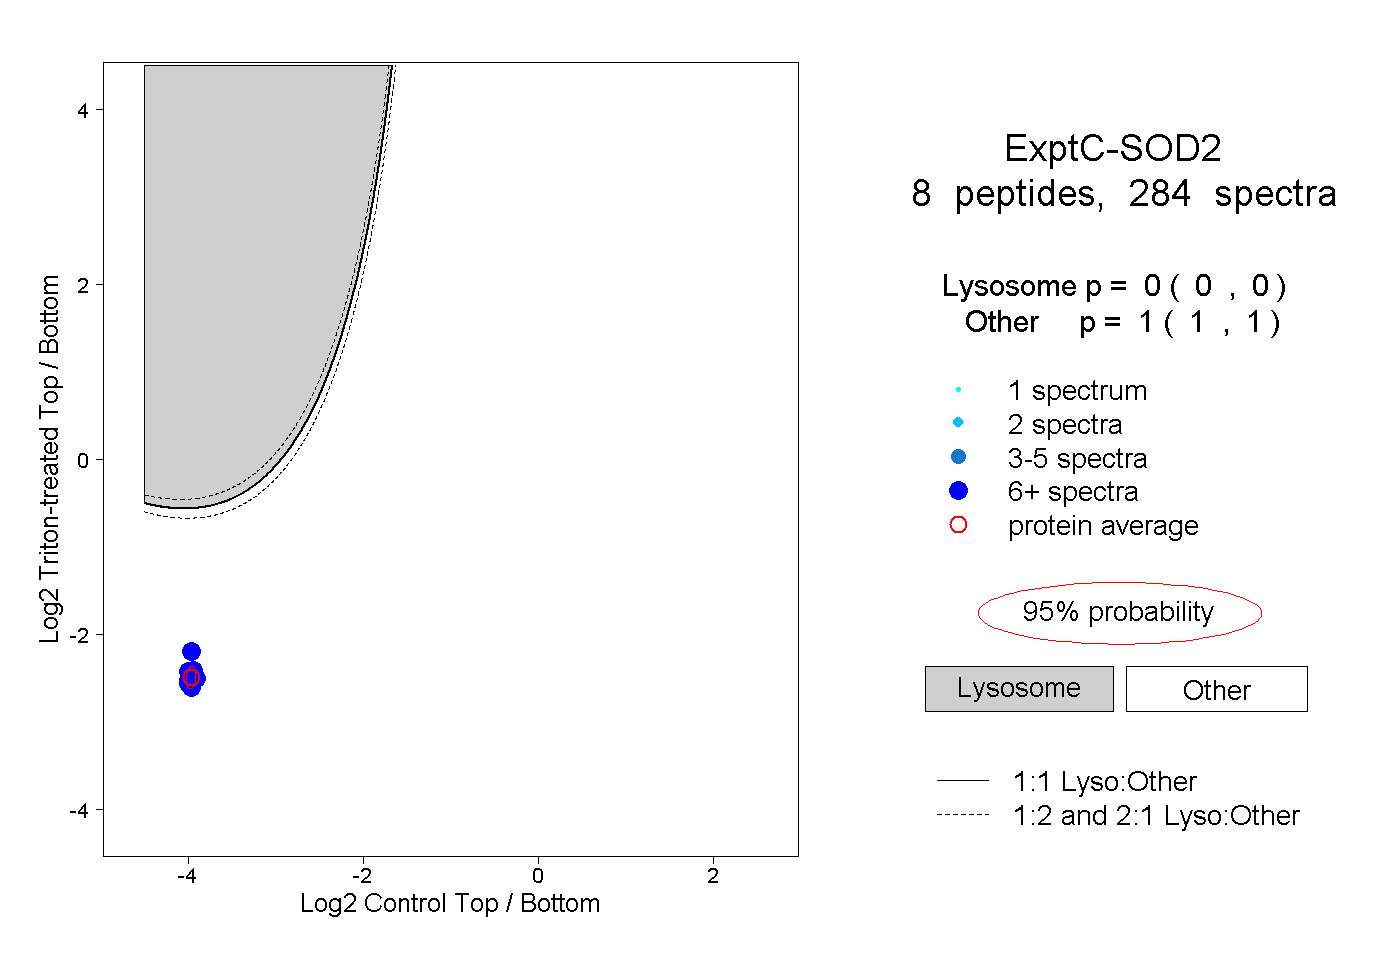 |
0.000 0.000 | 0.000 |
1.000 1.000 | 1.000 |
||||||||
| Plot | Lyso | Other | |||||||||||
| Expt D |
4 peptides |
24 spectra |
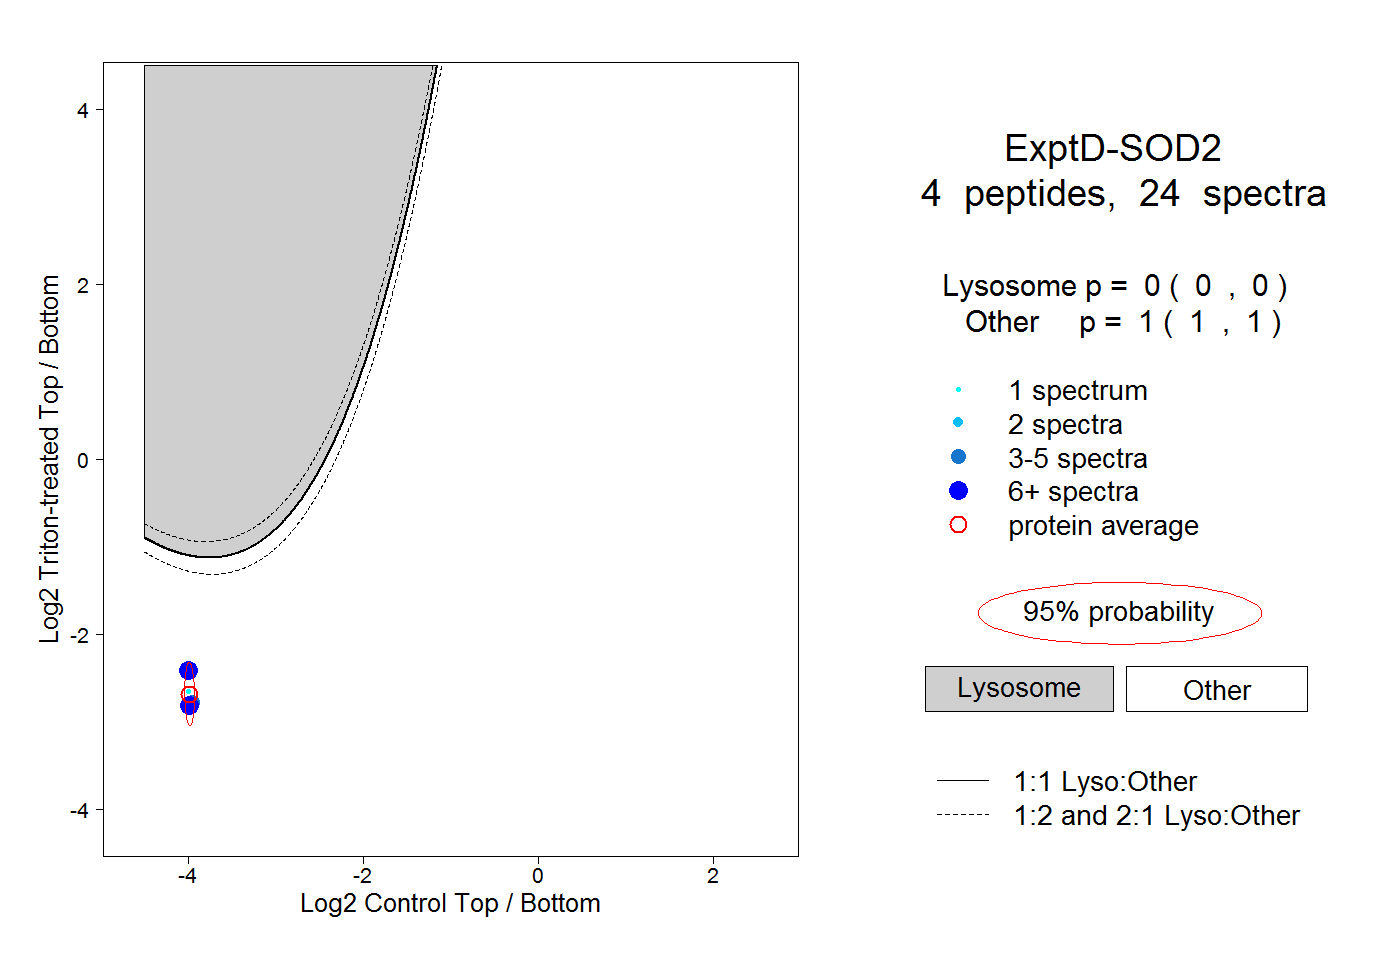 |
0.000 0.000 | 0.000 |
1.000 1.000 | 1.000 |