 6
6peptides
spectra
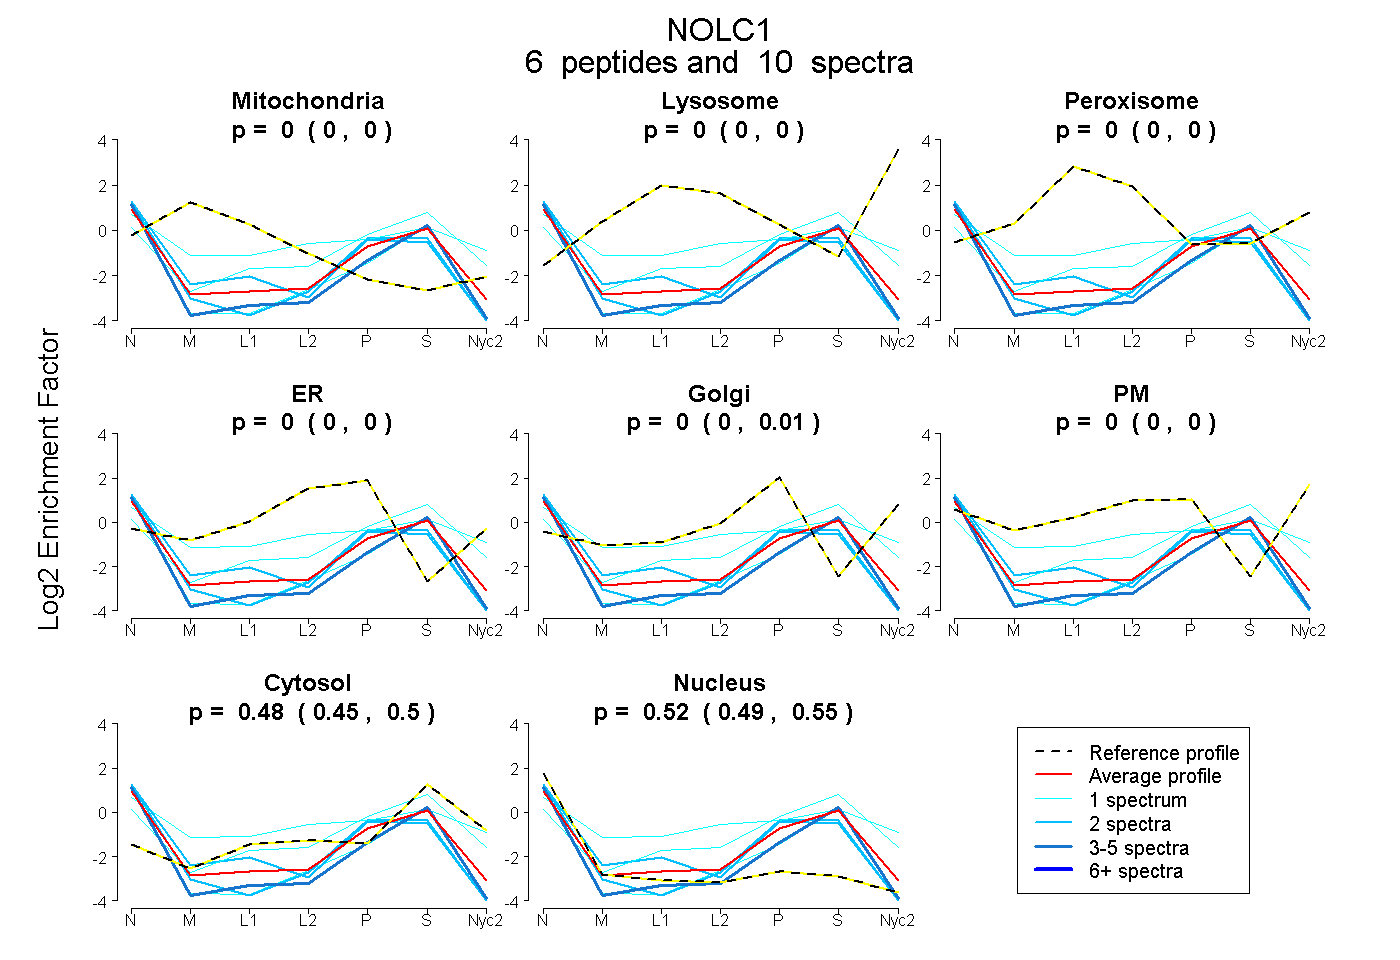
0.000 | 0.000
0.000 | 0.000
0.000 | 0.000
0.000 | 0.000
0.000 | 0.014
0.000 | 0.000
0.449 | 0.504
0.487 | 0.546
| Plot | Mito | Lyso | Perox | ER | Golgi | PM | Cytosol | Nucleus | |||||
| Expt A |
6 peptides |
10 spectra |
|
0.000 0.000 | 0.000 |
0.000 0.000 | 0.000 |
0.000 0.000 | 0.000 |
0.000 0.000 | 0.000 |
0.000 0.000 | 0.014 |
0.000 0.000 | 0.000 |
0.480 0.449 | 0.504 |
0.520 0.487 | 0.546 |
| 2 spectra, AAGTKPGSGK | 0.000 | 0.000 | 0.000 | 0.000 | 0.000 | 0.000 | 0.317 | 0.683 | ||
| 2 spectra, GAAGDWGER | 0.000 | 0.000 | 0.000 | 0.057 | 0.000 | 0.000 | 0.306 | 0.636 | ||
| 1 spectrum, DNQLSEVASK | 0.000 | 0.000 | 0.101 | 0.028 | 0.000 | 0.247 | 0.443 | 0.181 | ||
| 1 spectrum, AAGAAVPKPTPVK | 0.000 | 0.000 | 0.000 | 0.000 | 0.000 | 0.000 | 0.352 | 0.648 | ||
| 3 spectra, QPAGSGQKPQSR | 0.000 | 0.000 | 0.000 | 0.000 | 0.000 | 0.000 | 0.351 | 0.649 | ||
| 1 spectrum, HNETADEAATPQSK | 0.000 | 0.000 | 0.000 | 0.000 | 0.129 | 0.000 | 0.693 | 0.178 |
| Plot | Lyso | Other | |||||||||||
| Expt C |
1 peptide |
1 spectrum |
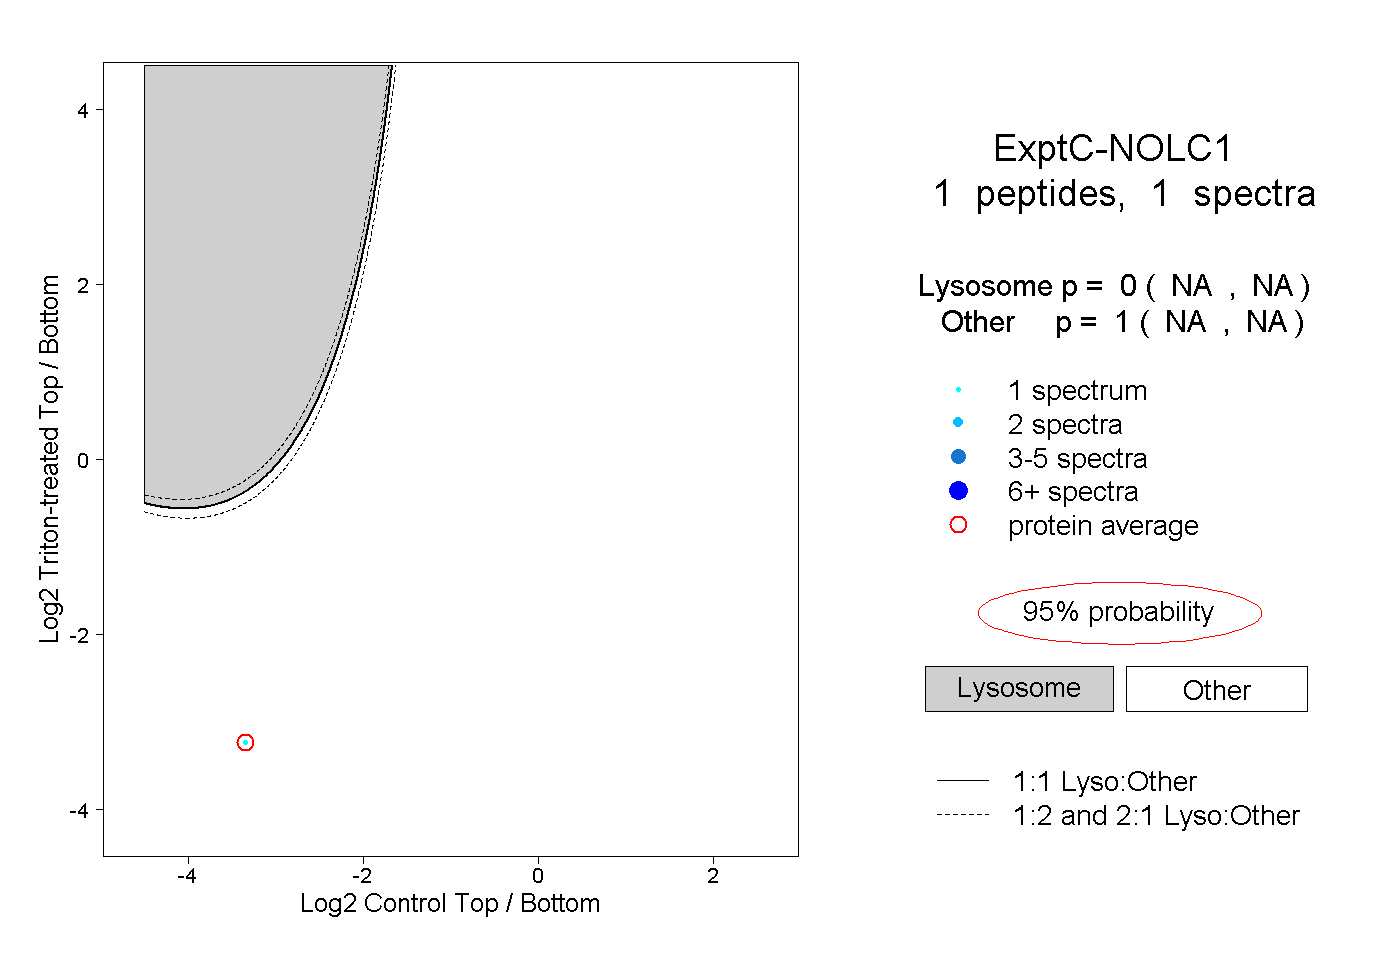 |
0.000 NA | NA |
1.000 NA | NA |