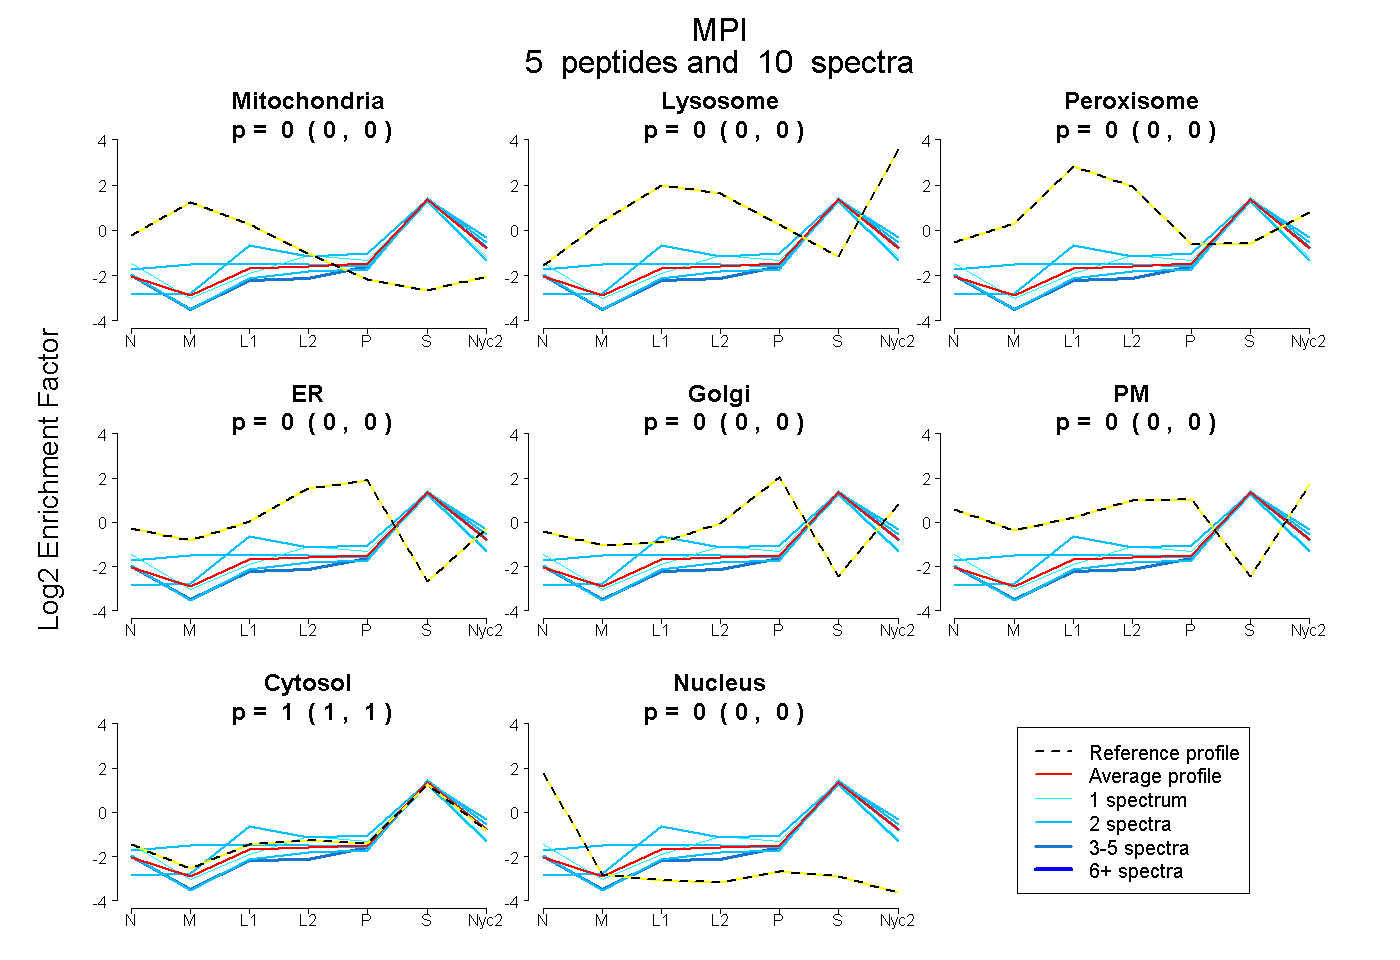
 5
5peptides
spectra
0.000 | 0.000
0.000 | 0.000
0.000 | 0.000
0.000 | 0.000
0.000 | 0.000
0.000 | 0.000
1.000 | 1.000
0.000 | 0.000
| Plot | Mito | Lyso | Perox | ER | Golgi | PM | Cytosol | Nucleus | |||||
| Expt A |
5 peptides |
10 spectra |
|
0.000 0.000 | 0.000 |
0.000 0.000 | 0.000 |
0.000 0.000 | 0.000 |
0.000 0.000 | 0.000 |
0.000 0.000 | 0.000 |
0.000 0.000 | 0.000 |
1.000 1.000 | 1.000 |
0.000 0.000 | 0.000 |
| 1 spectrum, SMNEGSGAMASALK | 0.000 | 0.000 | 0.000 | 0.000 | 0.000 | 0.000 | 0.973 | 0.027 | ||
| 2 spectra, NCFSHLMK | 0.114 | 0.000 | 0.000 | 0.000 | 0.000 | 0.000 | 0.886 | 0.000 | ||
| 2 spectra, NLLIFR | 0.000 | 0.000 | 0.000 | 0.000 | 0.000 | 0.000 | 1.000 | 0.000 | ||
| 3 spectra, LPFLFK | 0.000 | 0.000 | 0.000 | 0.000 | 0.000 | 0.000 | 0.978 | 0.022 | ||
| 2 spectra, VVVEQLNLLVK | 0.000 | 0.090 | 0.000 | 0.000 | 0.000 | 0.000 | 0.910 | 0.000 |
| Plot | Mito | Lyso or Perox | ER | Golgi | PM | Cytosol | Nucleus | ||||||
| Expt B |
1 peptide |
1 spectrum |
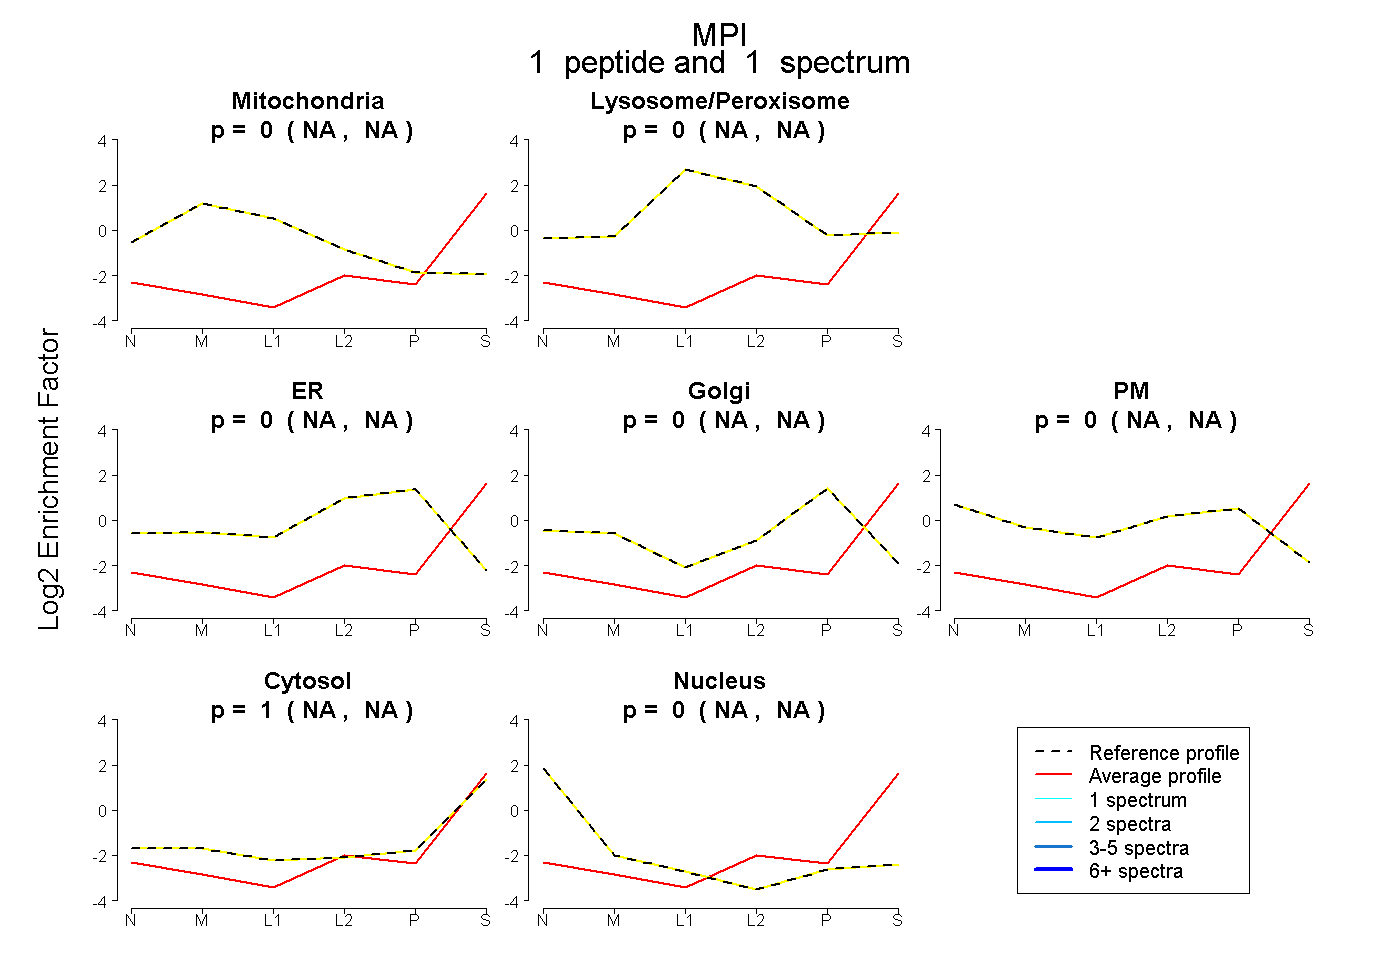 |
0.000 NA | NA |
0.000 NA | NA |
0.000 NA | NA |
0.000 NA | NA |
0.000 NA | NA |
1.000 NA | NA |
0.000 NA | NA |
|||
| Plot | Lyso | Other | |||||||||||
| Expt C |
3 peptides |
8 spectra |
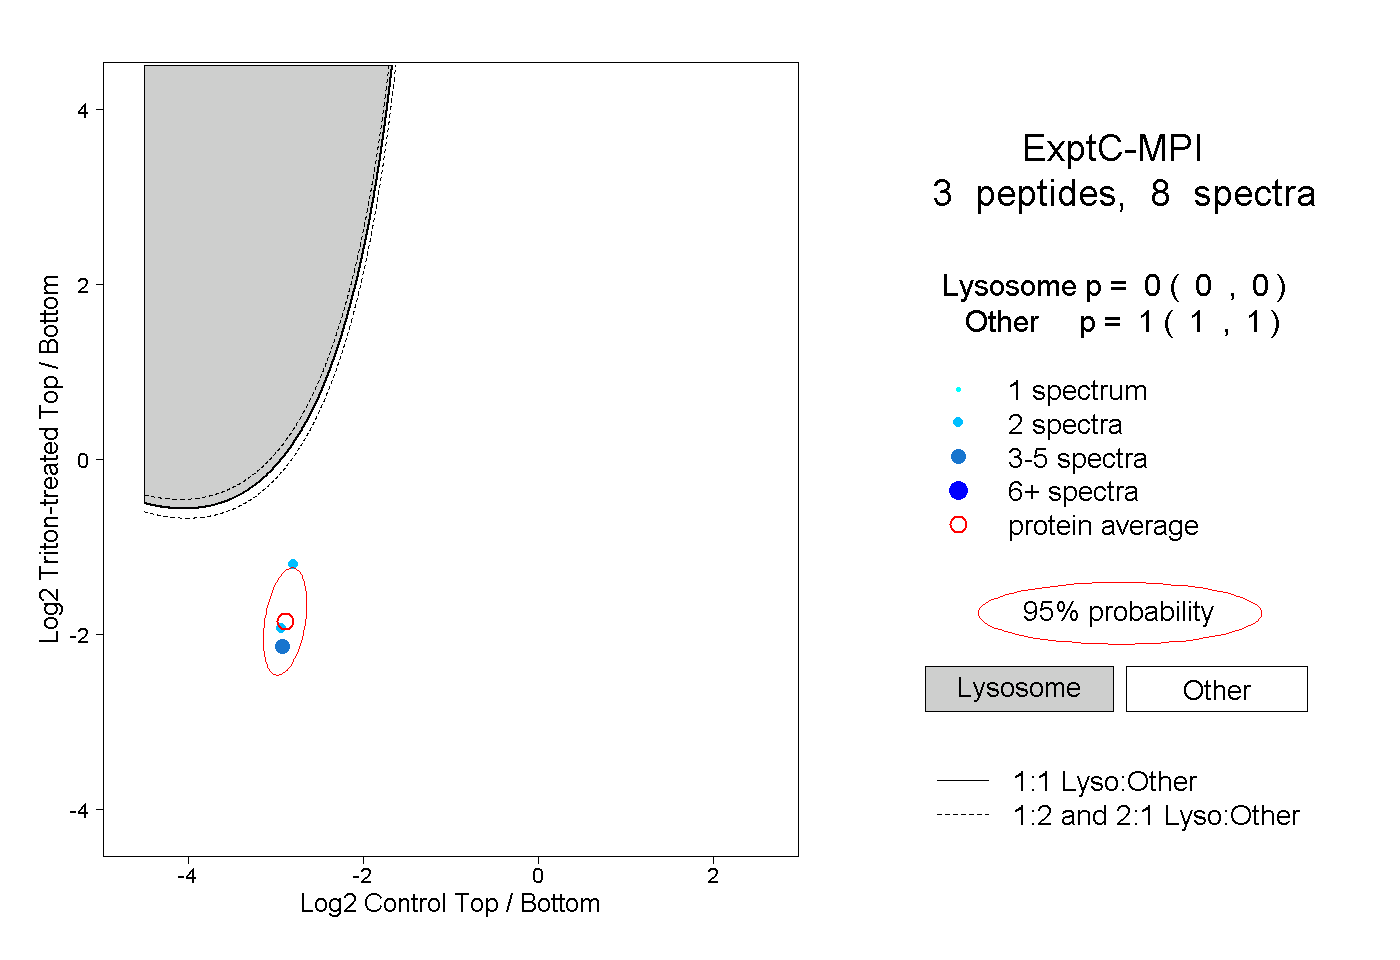 |
0.000 0.000 | 0.000 |
1.000 1.000 | 1.000 |