23
23peptides
spectra
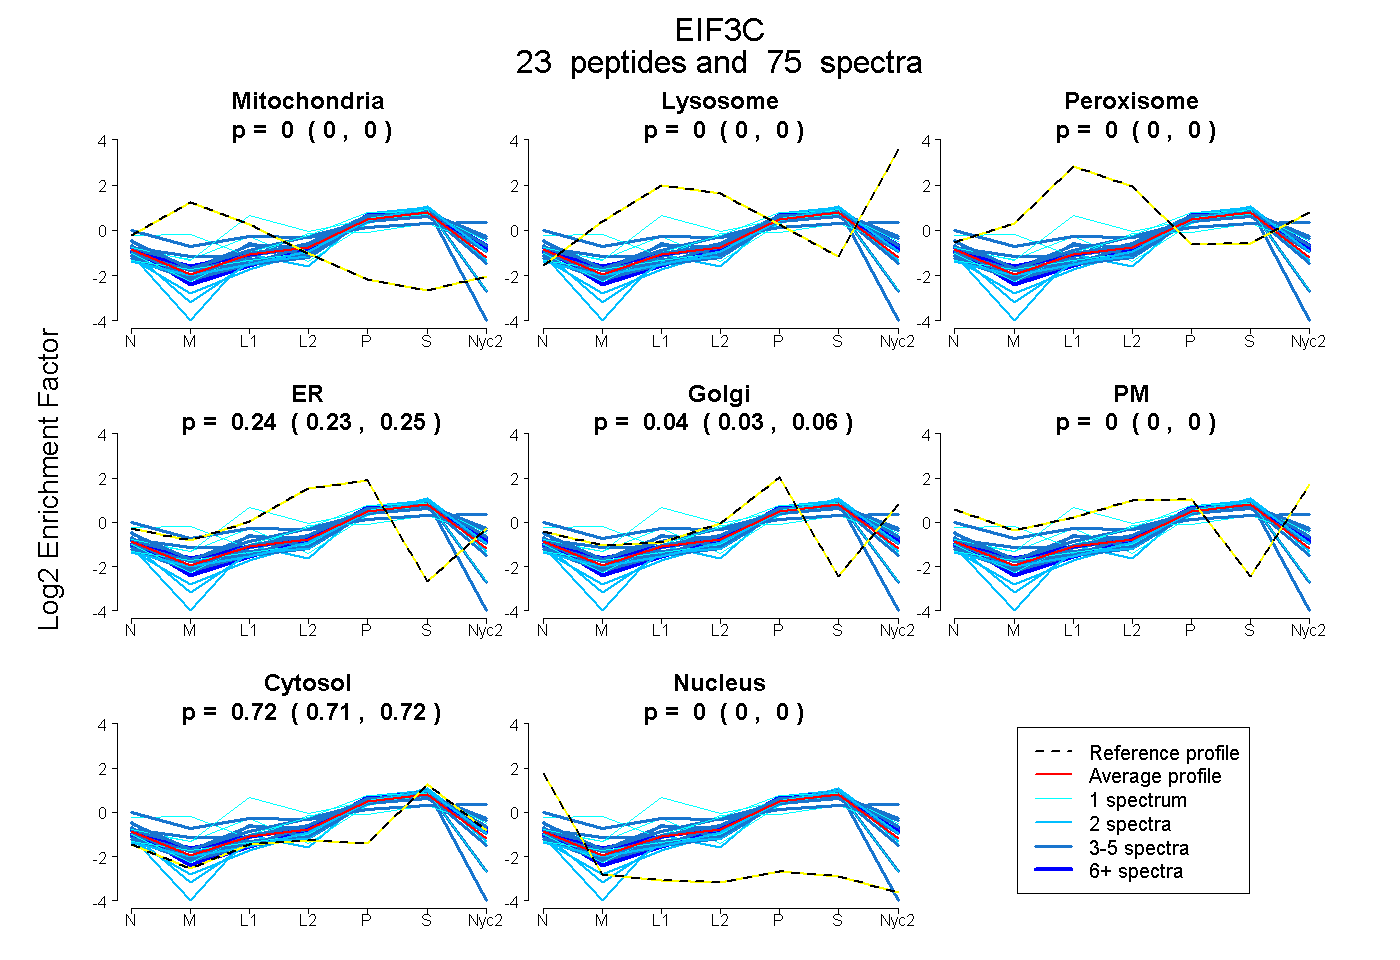
0.000 | 0.000
0.000 | 0.000
0.000 | 0.000
0.225 | 0.252
0.026 | 0.059
0.000 | 0.000
0.713 | 0.719
0.000 | 0.000
13peptides
spectra
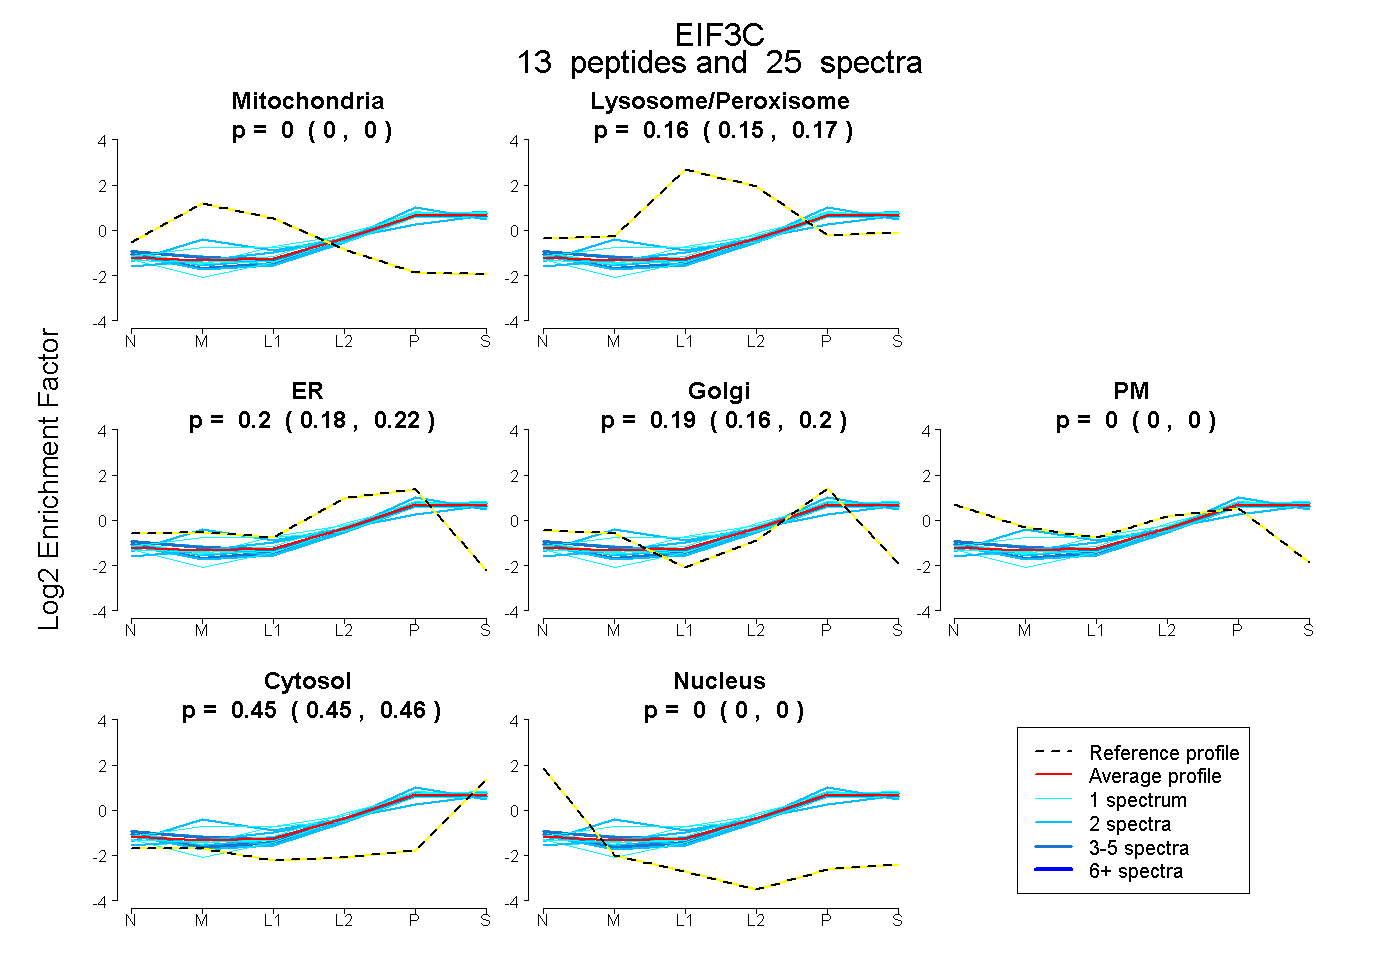
0.000 | 0.000
0.146 | 0.167
0.177 | 0.223
0.164 | 0.204
0.000 | 0.000
0.446 | 0.462
0.000 | 0.000