 23
23peptides
spectra
0.000 | 0.000
0.000 | 0.000
0.000 | 0.000
0.225 | 0.252
0.026 | 0.059
0.000 | 0.000
0.713 | 0.719
0.000 | 0.000
| Plot | Mito | Lyso | Perox | ER | Golgi | PM | Cytosol | Nucleus | |||||
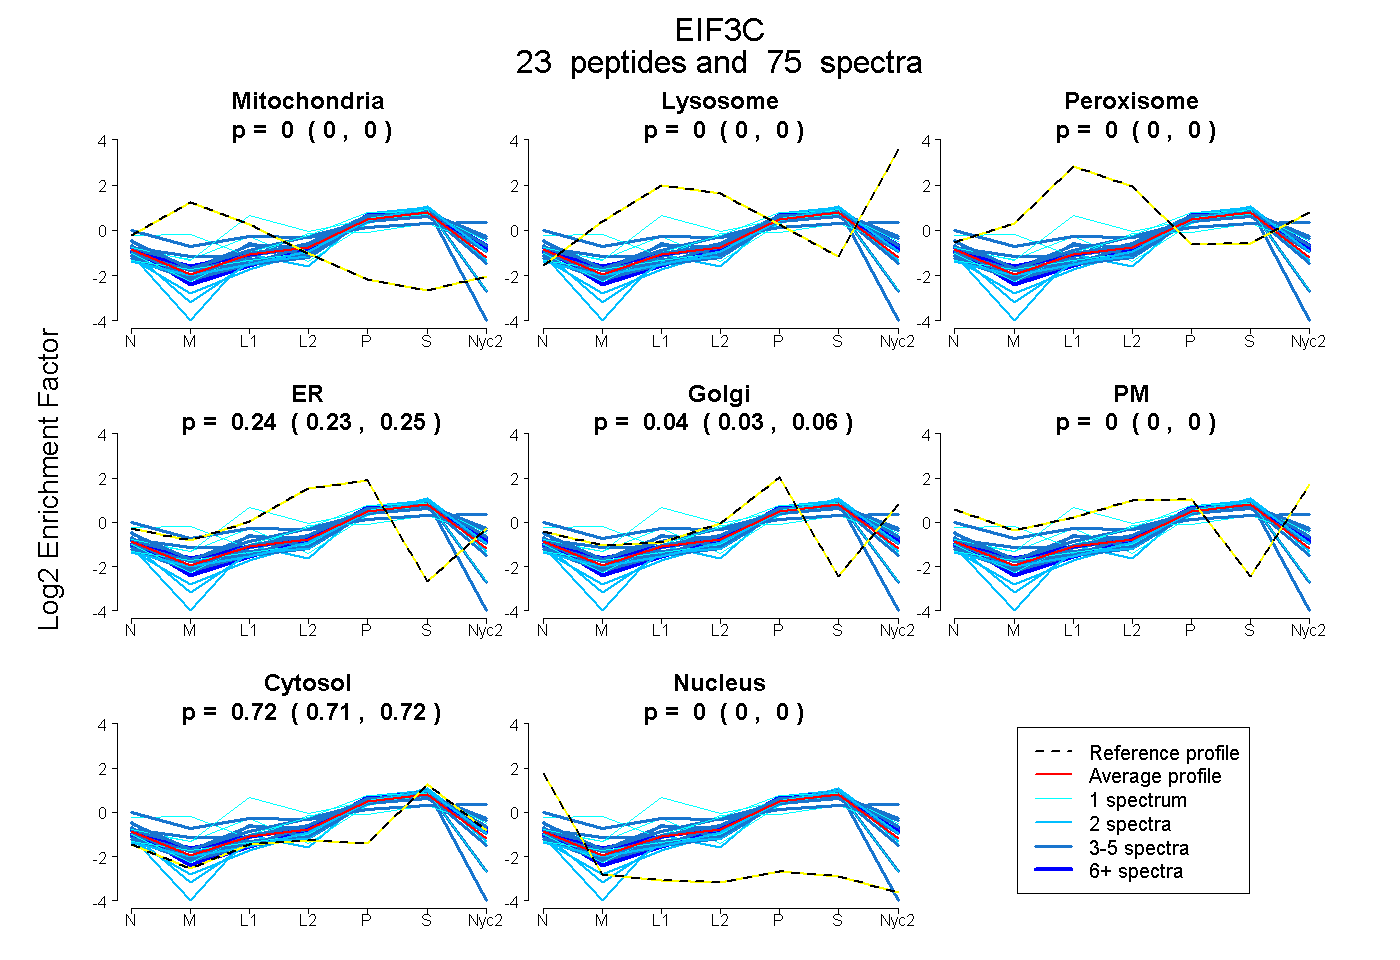
| Expt A |
23 peptides |
75 spectra |
|
0.000 0.000 | 0.000 |
0.000 0.000 | 0.000 |
0.000 0.000 | 0.000 |
0.240 0.225 | 0.252 |
0.044 0.026 | 0.059 |
0.000 0.000 | 0.000 |
0.716 0.713 | 0.719 |
0.000 0.000 | 0.000 |
| 3 spectra, GTTEEICQIYLR | 0.000 | 0.000 | 0.000 | 0.181 | 0.000 | 0.000 | 0.686 | 0.133 | ||
| 4 spectra, DAHNALLDIQSSGR | 0.000 | 0.000 | 0.000 | 0.161 | 0.125 | 0.000 | 0.714 | 0.000 | ||
| 1 spectrum, IMQNTDPHSQEYVEHLK | 0.153 | 0.000 | 0.018 | 0.137 | 0.000 | 0.191 | 0.502 | 0.000 | ||
| 6 spectra, FEELTNLIR | 0.000 | 0.000 | 0.000 | 0.000 | 0.309 | 0.000 | 0.691 | 0.000 | ||
| 3 spectra, ELLGQGLLLR | 0.000 | 0.000 | 0.000 | 0.000 | 0.298 | 0.000 | 0.702 | 0.000 | ||
| 4 spectra, ALSTLR | 0.000 | 0.000 | 0.000 | 0.026 | 0.259 | 0.000 | 0.715 | 0.000 | ||
| 3 spectra, MIINEELMASLDQPTQTVVMHR | 0.000 | 0.000 | 0.133 | 0.000 | 0.000 | 0.383 | 0.484 | 0.000 | ||
| 2 spectra, CLEEFELLGK | 0.000 | 0.000 | 0.000 | 0.063 | 0.000 | 0.000 | 0.743 | 0.194 | ||
| 2 spectra, VWDLFPEADK | 0.000 | 0.000 | 0.000 | 0.039 | 0.211 | 0.000 | 0.750 | 0.000 | ||
| 4 spectra, GCILTLVER | 0.000 | 0.000 | 0.000 | 0.165 | 0.000 | 0.000 | 0.752 | 0.083 | ||
| 5 spectra, QPLLGPPESMR | 0.000 | 0.000 | 0.009 | 0.056 | 0.289 | 0.000 | 0.645 | 0.000 | ||
| 3 spectra, NQEQEK | 0.000 | 0.000 | 0.000 | 0.078 | 0.251 | 0.000 | 0.671 | 0.000 | ||
| 2 spectra, GGVPLVK | 0.000 | 0.000 | 0.000 | 0.035 | 0.163 | 0.000 | 0.794 | 0.008 | ||
| 1 spectrum, DFESHITNYK | 0.083 | 0.000 | 0.045 | 0.128 | 0.074 | 0.000 | 0.671 | 0.000 | ||
| 1 spectrum, NEGYMR | 0.000 | 0.000 | 0.354 | 0.058 | 0.127 | 0.000 | 0.461 | 0.000 | ||
| 11 spectra, MDEEFTK | 0.000 | 0.000 | 0.000 | 0.195 | 0.130 | 0.000 | 0.675 | 0.000 | ||
| 1 spectrum, TMVQLGICAFR | 0.000 | 0.000 | 0.000 | 0.213 | 0.000 | 0.000 | 0.736 | 0.051 | ||
| 3 spectra, GTEITHAVVIK | 0.000 | 0.000 | 0.038 | 0.191 | 0.123 | 0.000 | 0.649 | 0.000 | ||
| 4 spectra, ILHTYYK | 0.000 | 0.000 | 0.000 | 0.272 | 0.000 | 0.000 | 0.695 | 0.033 | ||
| 5 spectra, QFHHQLR | 0.000 | 0.000 | 0.000 | 0.354 | 0.000 | 0.000 | 0.646 | 0.000 | ||
| 4 spectra, LGSLVENNER | 0.000 | 0.000 | 0.058 | 0.020 | 0.354 | 0.000 | 0.569 | 0.000 | ||
| 1 spectrum, QGTYGGYFR | 0.000 | 0.000 | 0.000 | 0.230 | 0.118 | 0.000 | 0.652 | 0.000 | ||
| 2 spectra, EHVVAASK | 0.000 | 0.000 | 0.000 | 0.000 | 0.198 | 0.000 | 0.802 | 0.000 |
| Plot | Mito | Lyso or Perox | ER | Golgi | PM | Cytosol | Nucleus | ||||||
| Expt B |
13 peptides |
25 spectra |
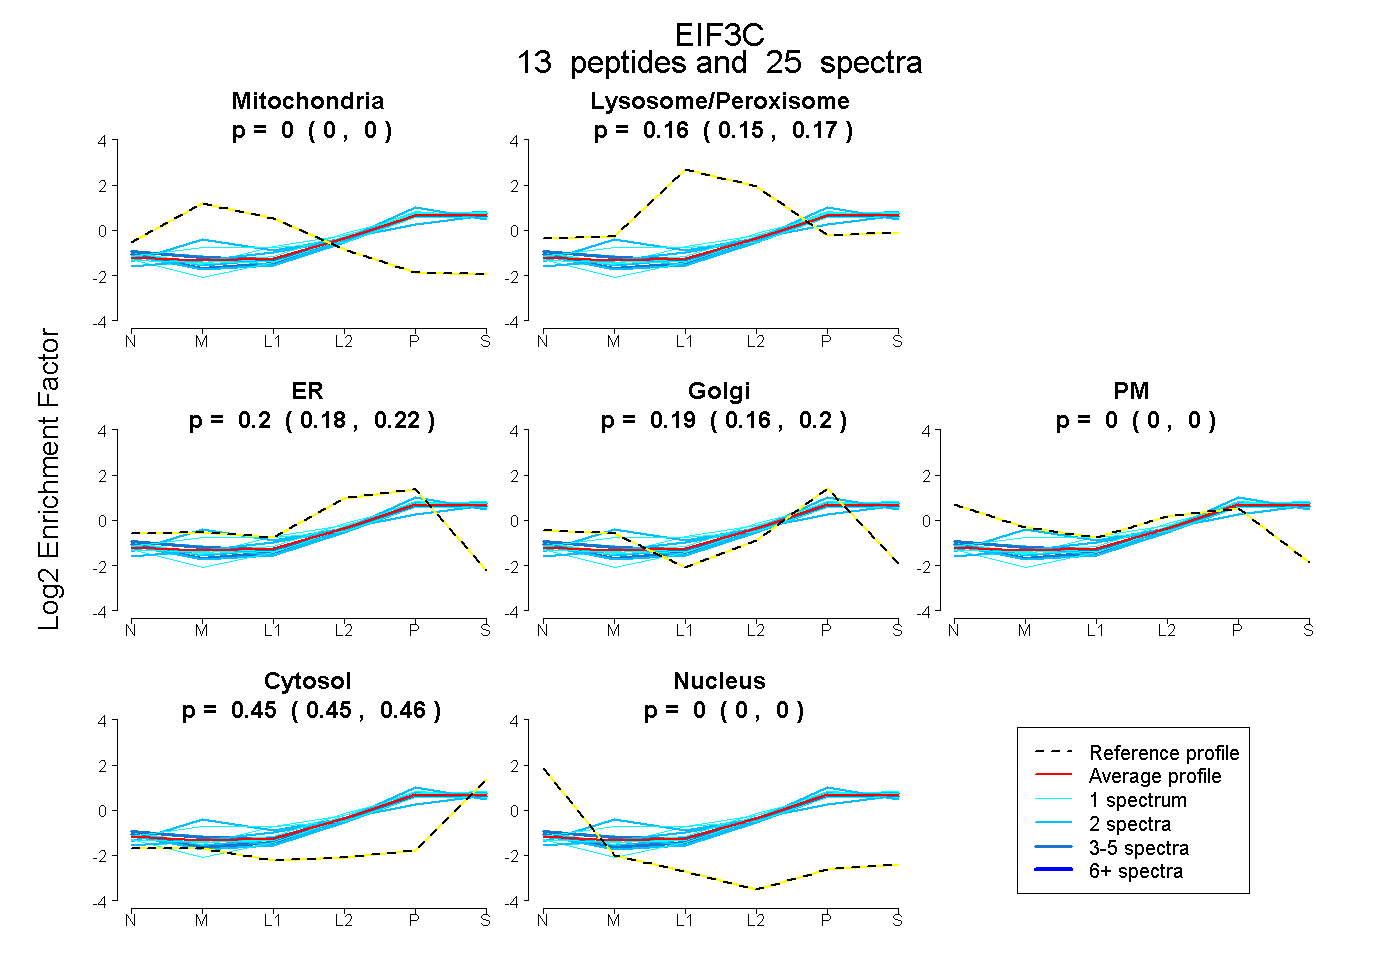 |
0.000 0.000 | 0.000 |
0.157 0.146 | 0.167 |
0.203 0.177 | 0.223 |
0.185 0.164 | 0.204 |
0.000 0.000 | 0.000 |
0.455 0.446 | 0.462 |
0.000 0.000 | 0.000 |
|||
| Plot | Lyso | Other | |||||||||||
| Expt C |
19 peptides |
67 spectra |
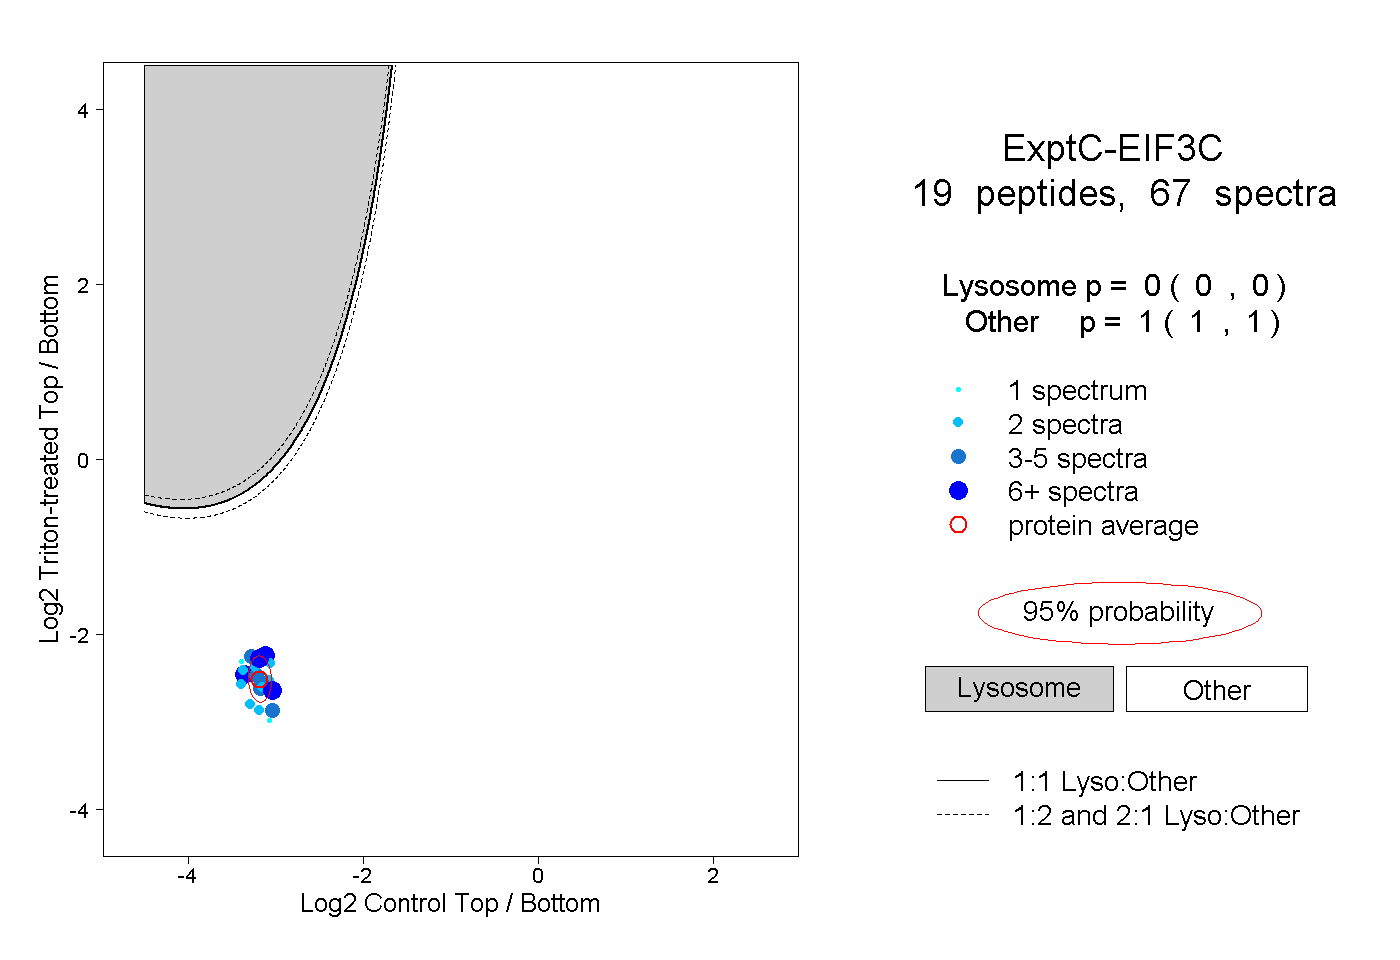 |
0.000 0.000 | 0.000 |
1.000 1.000 | 1.000 |
||||||||
| Plot | Lyso | Other | |||||||||||
| Expt D |
4 peptides |
5 spectra |
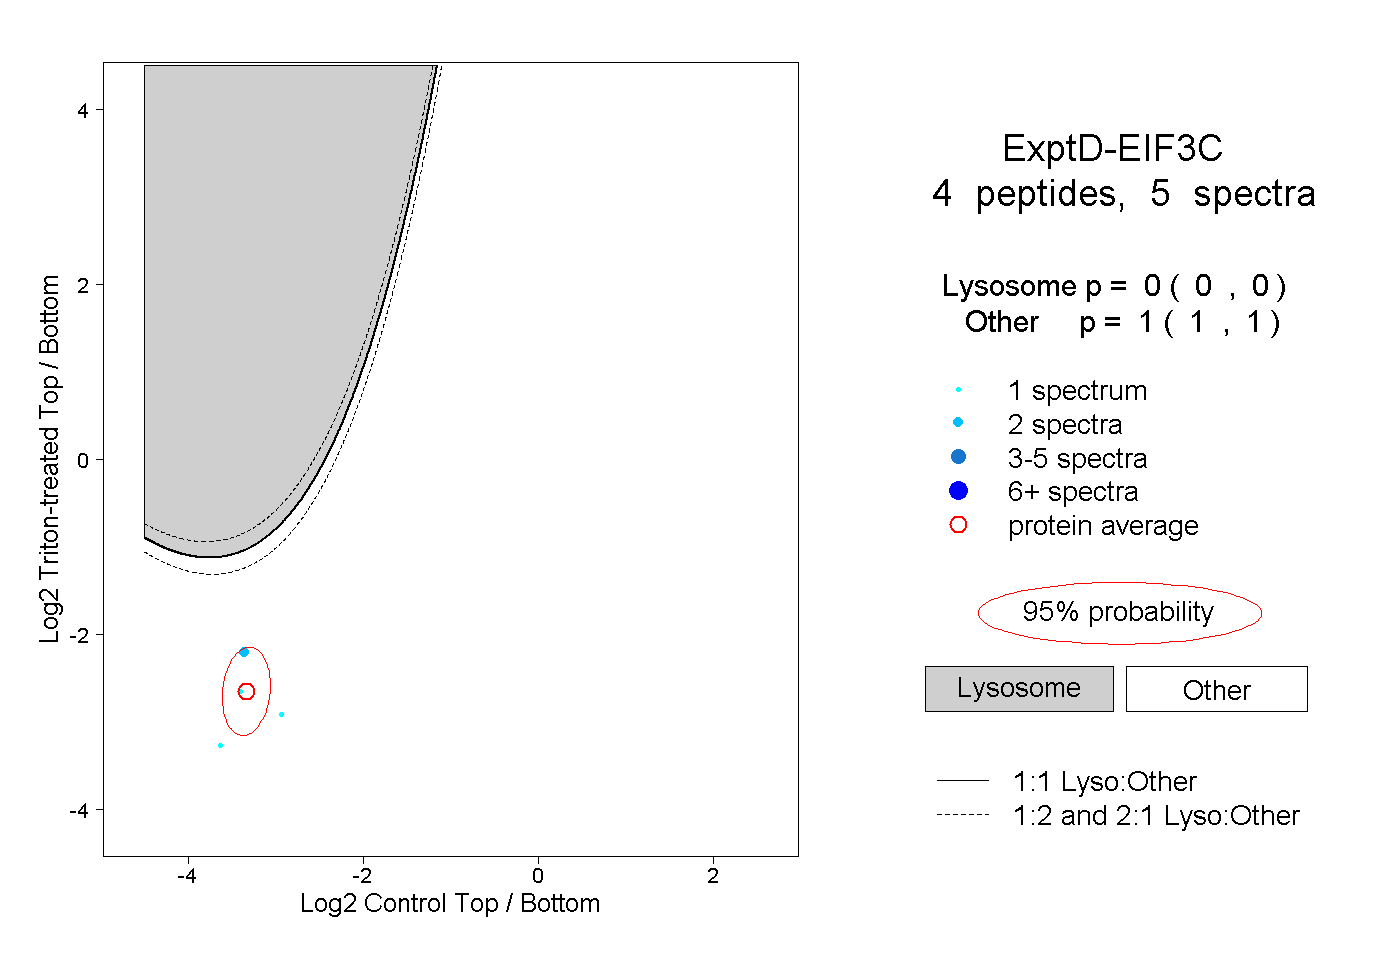 |
0.000 0.000 | 0.000 |
1.000 1.000 | 1.000 |