 4
4peptides
spectra
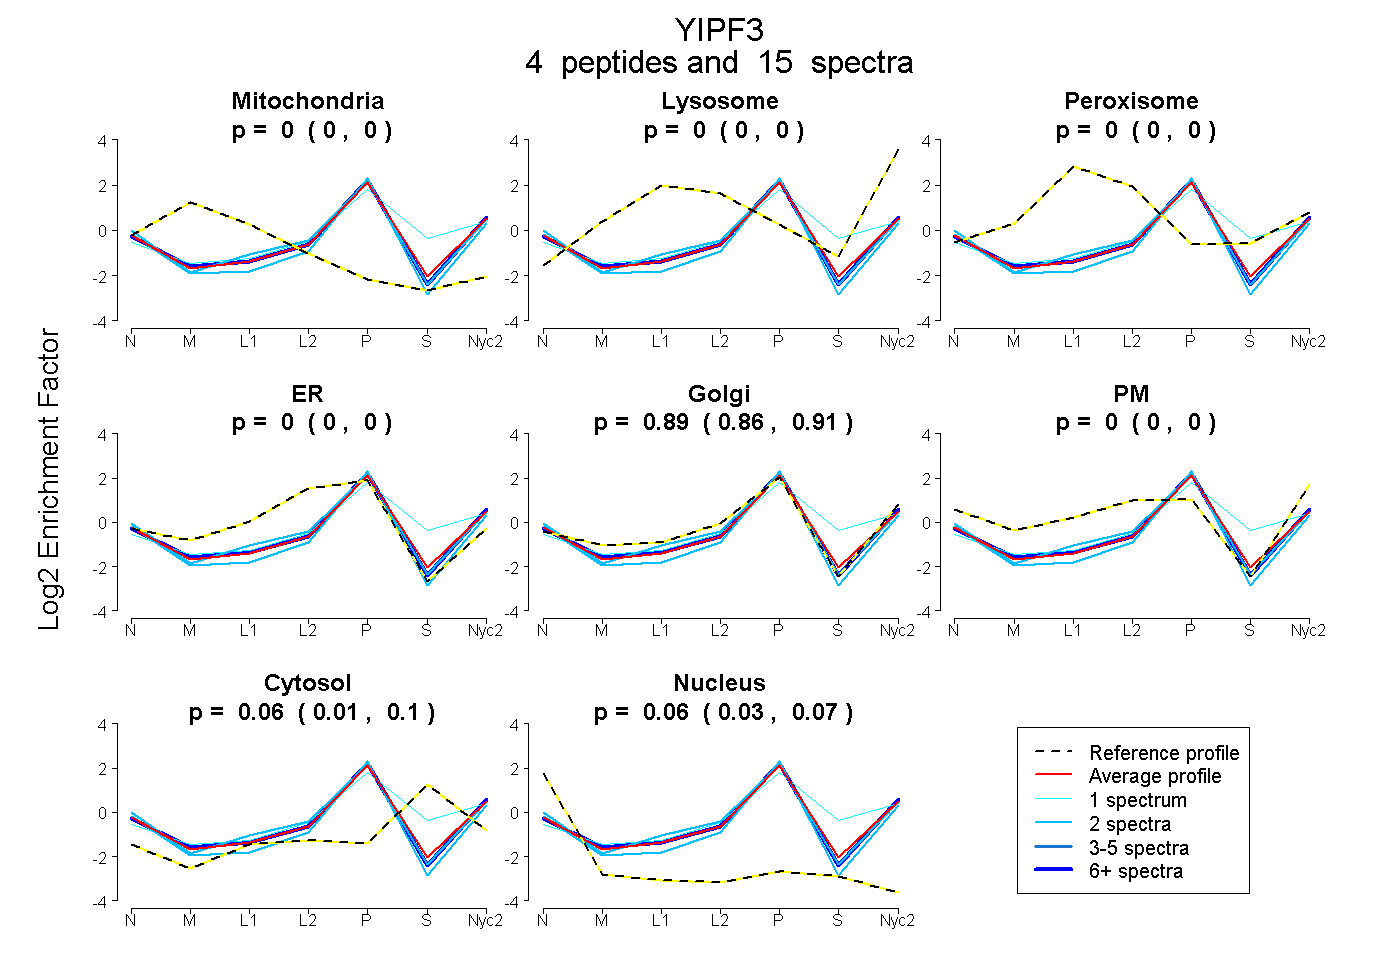
0.000 | 0.000
0.000 | 0.000
0.000 | 0.000
0.000 | 0.000
0.861 | 0.910
0.000 | 0.000
0.008 | 0.096
0.033 | 0.075
1peptide
spectra
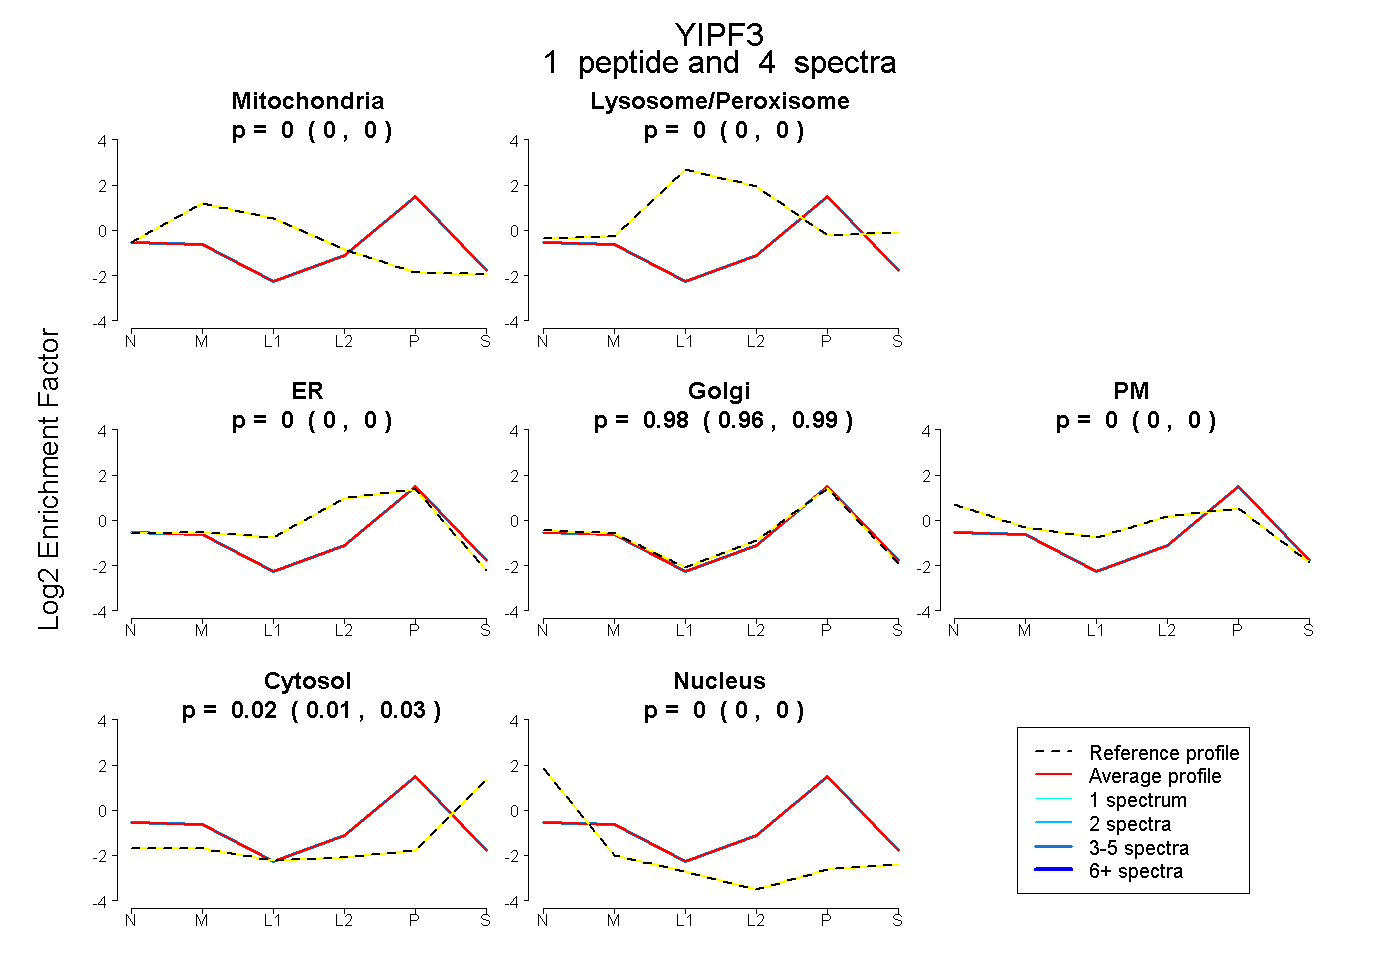
0.000 | 0.000
0.000 | 0.000
0.000 | 0.000
0.965 | 0.987
0.000 | 0.000
0.010 | 0.033
0.000 | 0.003
3peptides
spectra
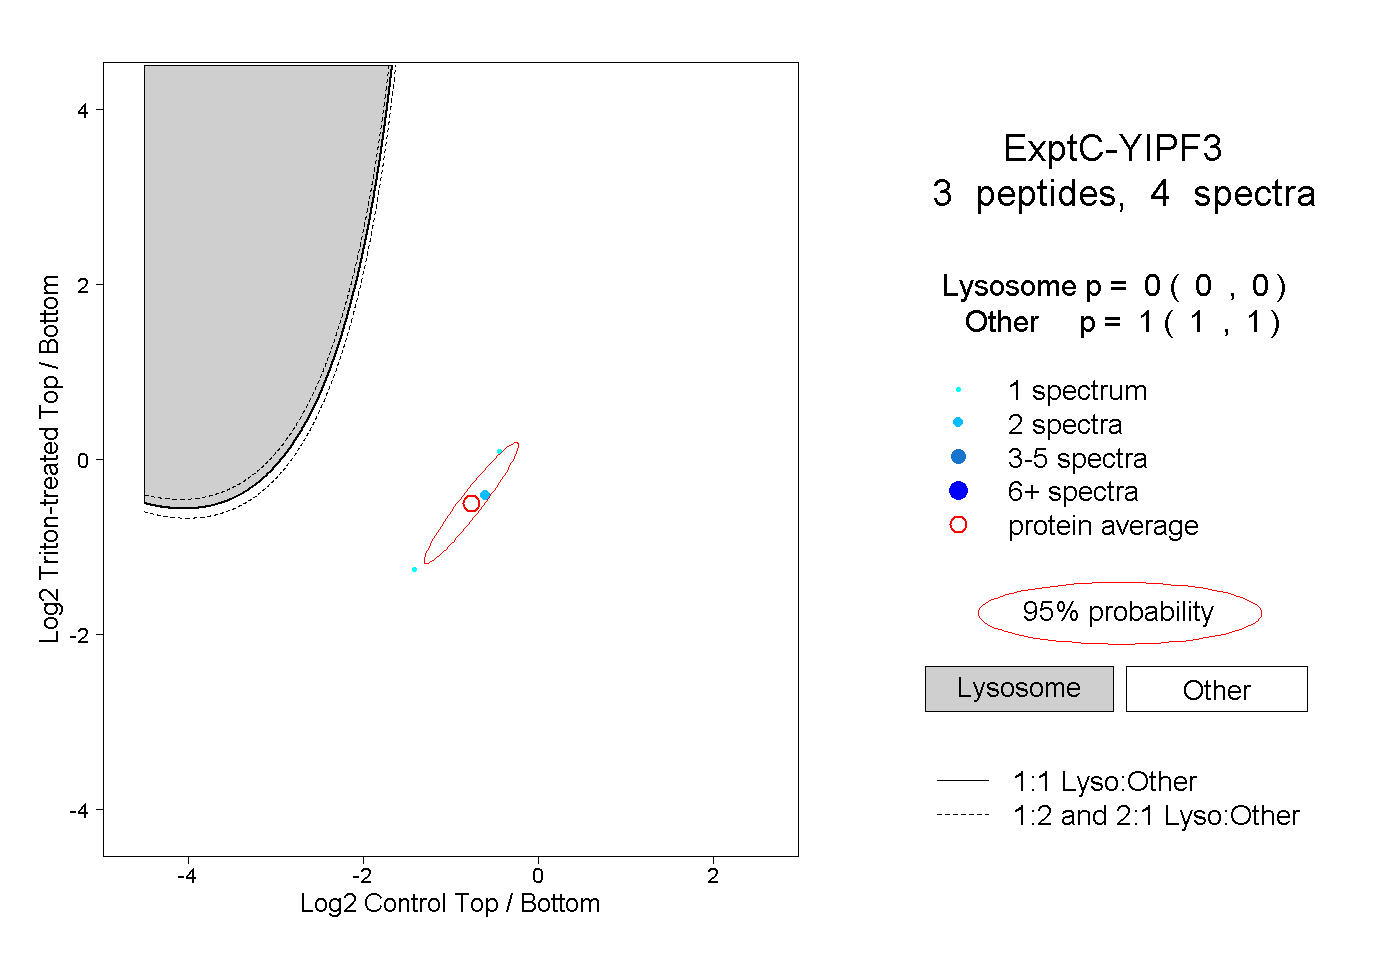
0.000 | 0.000
1.000 | 1.000
1peptide
spectra
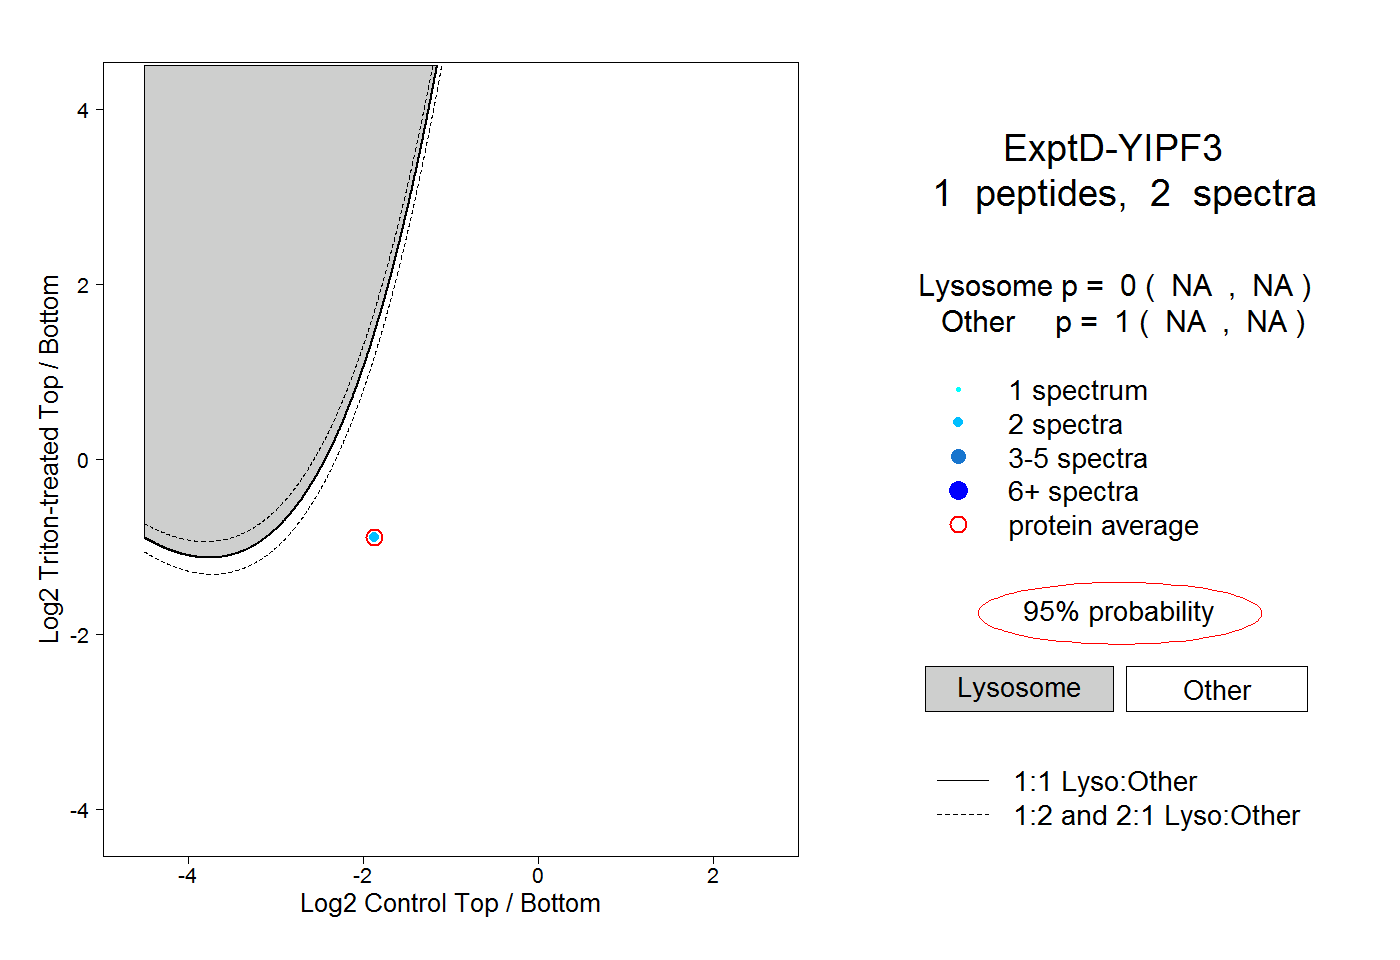
NA | NA
NA | NA