 8
8peptides
spectra
0.000 | 0.000
0.000 | 0.000
0.000 | 0.000
0.509 | 0.544
0.000 | 0.037
0.000 | 0.000
0.447 | 0.458
0.000 | 0.000
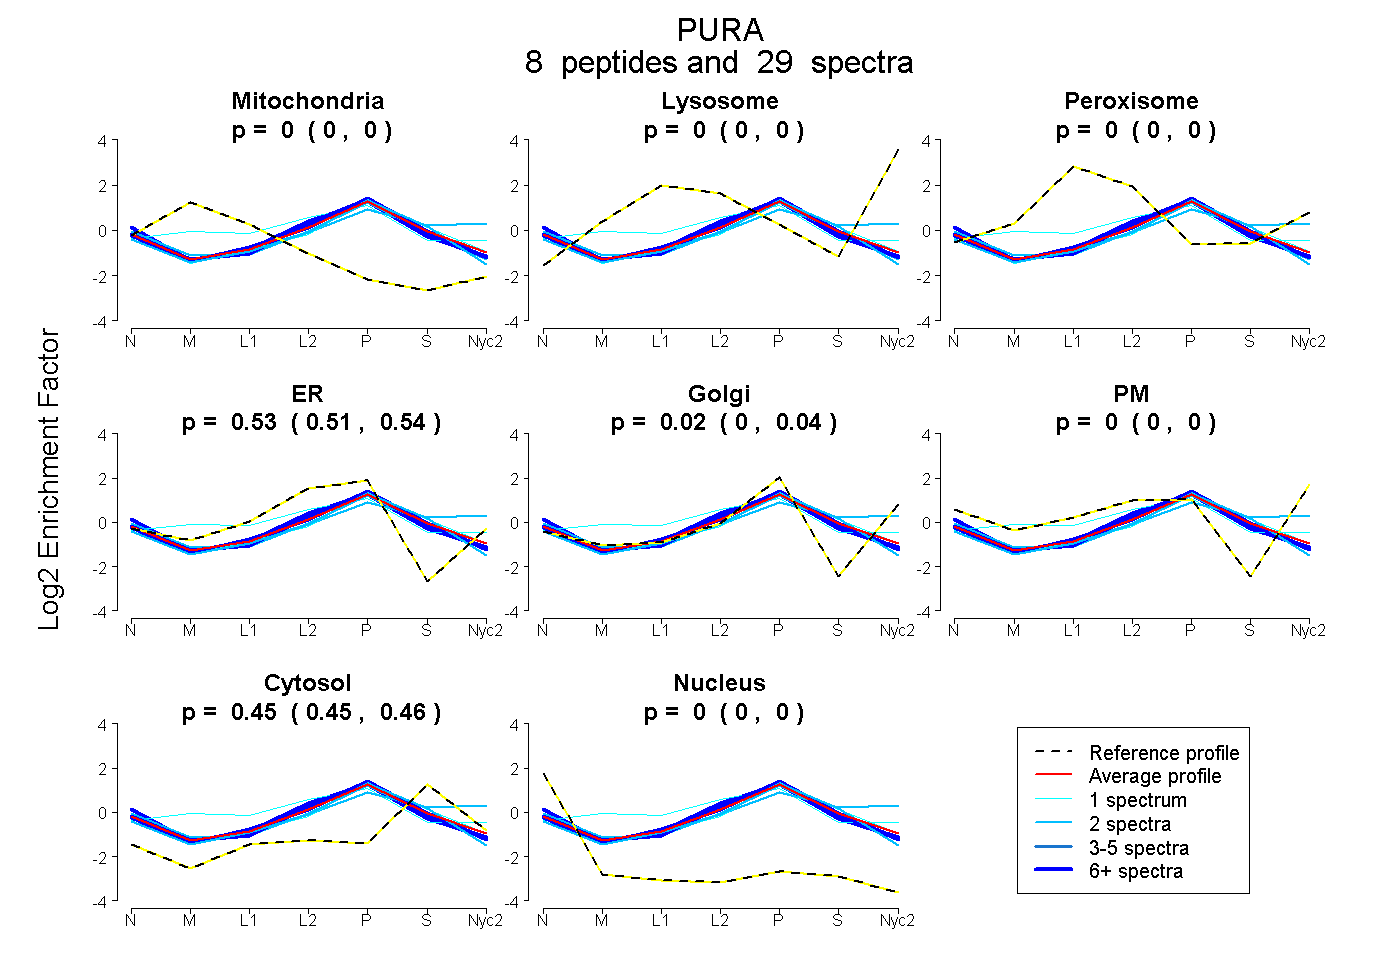
| Plot | Mito | Lyso | Perox | ER | Golgi | PM | Cytosol | Nucleus | |||||
| Expt A |
8 peptides |
29 spectra |
|
0.000 0.000 | 0.000 |
0.000 0.000 | 0.000 |
0.000 0.000 | 0.000 |
0.530 0.509 | 0.544 |
0.017 0.000 | 0.037 |
0.000 0.000 | 0.000 |
0.453 0.447 | 0.458 |
0.000 0.000 | 0.000 |
| 8 spectra, YGVFMR | 0.000 | 0.000 | 0.000 | 0.549 | 0.000 | 0.000 | 0.451 | 0.000 | ||
| 1 spectrum, FGHTFCK | 0.038 | 0.000 | 0.193 | 0.394 | 0.128 | 0.000 | 0.247 | 0.000 | ||
| 1 spectrum, YSEEMK | 0.000 | 0.000 | 0.000 | 0.399 | 0.119 | 0.000 | 0.482 | 0.000 | ||
| 7 spectra, FFFDVGSNK | 0.000 | 0.000 | 0.000 | 0.587 | 0.000 | 0.000 | 0.390 | 0.023 | ||
| 2 spectra, NSITVPYK | 0.000 | 0.000 | 0.045 | 0.000 | 0.286 | 0.227 | 0.442 | 0.000 | ||
| 2 spectra, YYMDLK | 0.000 | 0.000 | 0.000 | 0.488 | 0.000 | 0.000 | 0.512 | 0.000 | ||
| 2 spectra, IAEVGAGGNK | 0.000 | 0.000 | 0.000 | 0.511 | 0.015 | 0.000 | 0.436 | 0.038 | ||
| 6 spectra, VSEVKPTYR | 0.000 | 0.000 | 0.000 | 0.557 | 0.000 | 0.000 | 0.443 | 0.000 |
| Plot | Mito | Lyso or Perox | ER | Golgi | PM | Cytosol | Nucleus | ||||||
| Expt B |
3 peptides |
6 spectra |
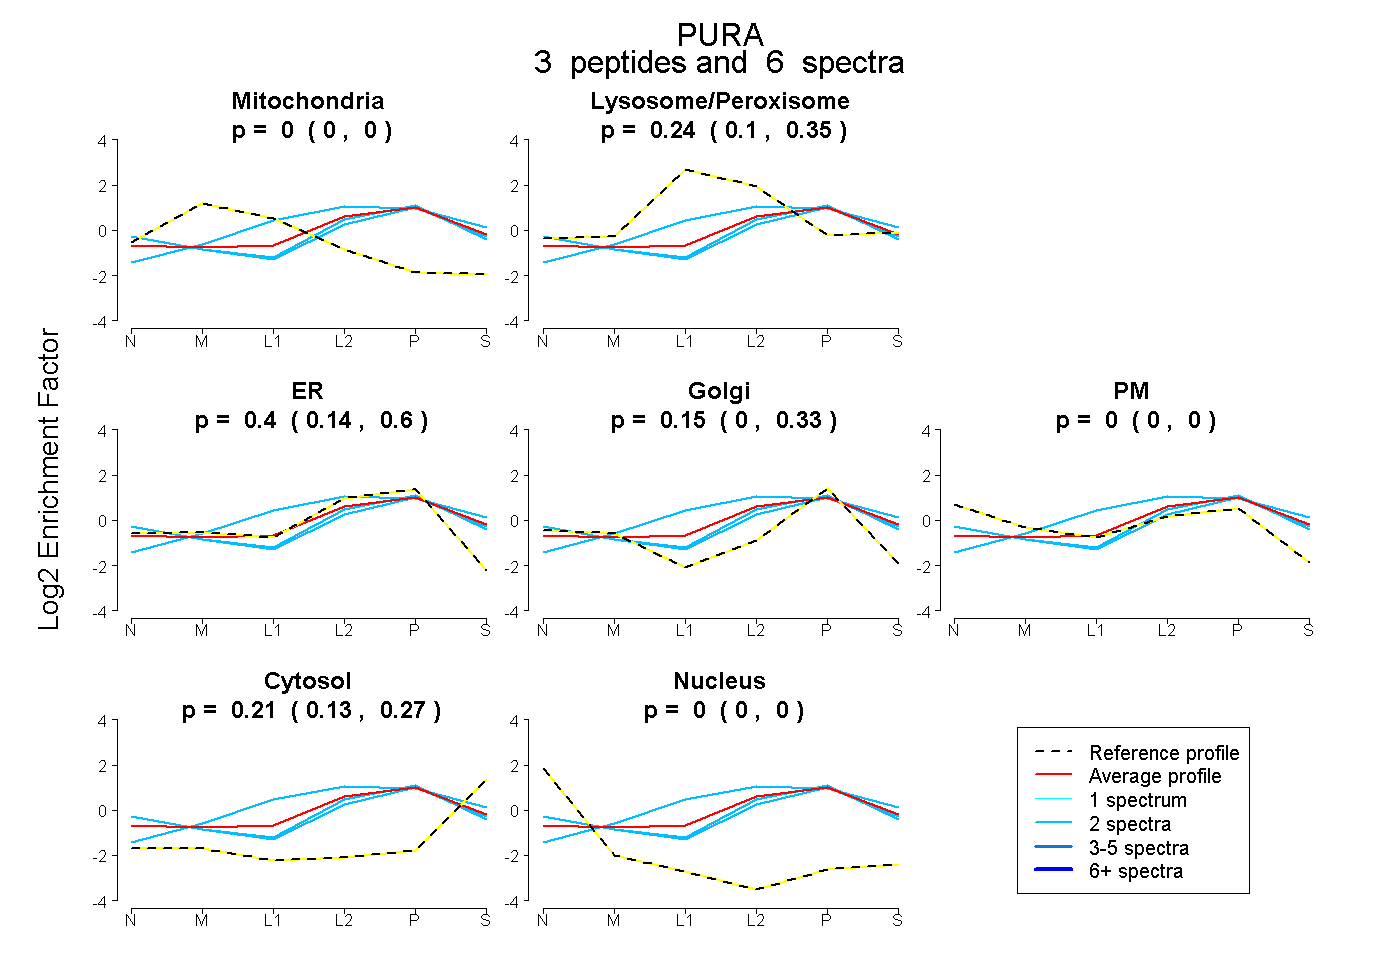 |
0.000 0.000 | 0.000 |
0.239 0.100 | 0.350 |
0.401 0.144 | 0.599 |
0.154 0.000 | 0.334 |
0.000 0.000 | 0.000 |
0.205 0.129 | 0.265 |
0.000 0.000 | 0.000 |
|||
| Plot | Lyso | Other | |||||||||||
| Expt C |
7 peptides |
32 spectra |
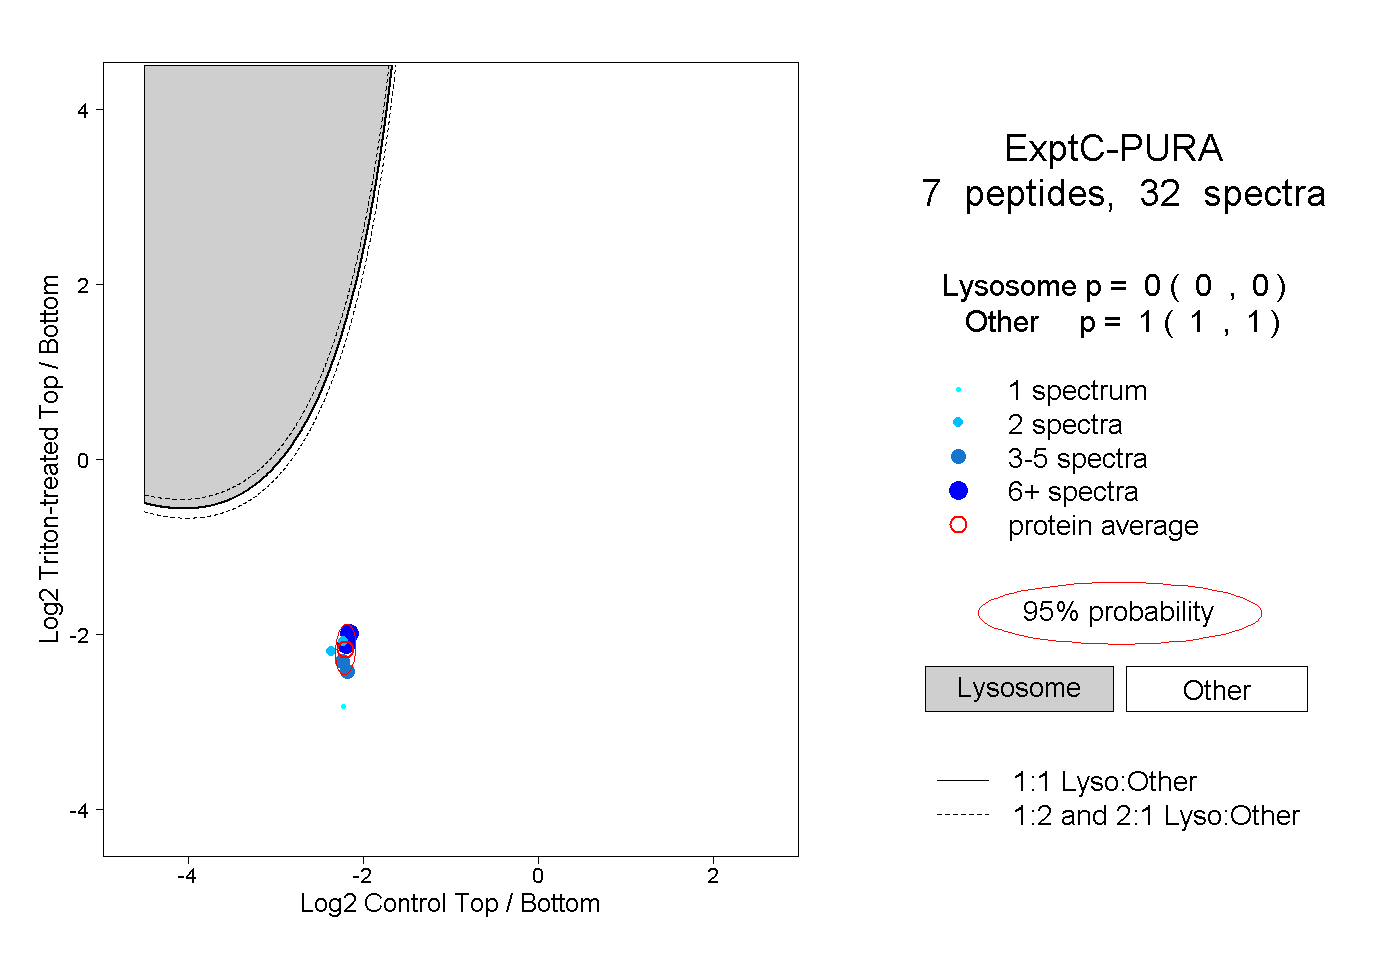 |
0.000 0.000 | 0.000 |
1.000 1.000 | 1.000 |
||||||||
| Plot | Lyso | Other | |||||||||||
| Expt D |
4 peptides |
9 spectra |
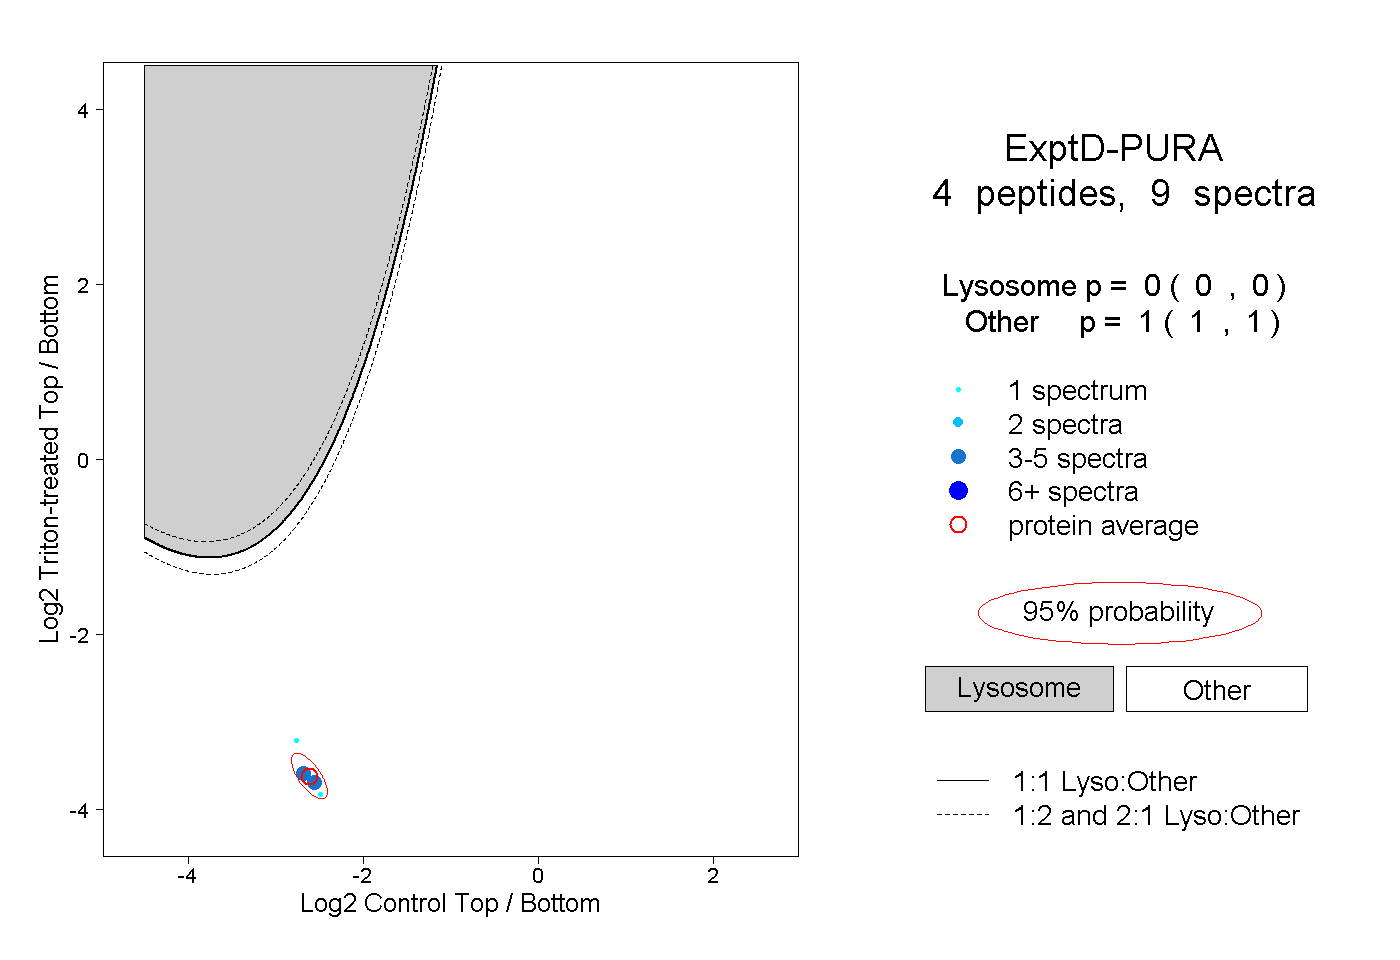 |
0.000 0.000 | 0.000 |
1.000 1.000 | 1.000 |