ATG9A
[ENSRNOP00000025740]
Main page
| | | Plot |
Mito |
Lyso |
|
Perox |
ER |
Golgi |
PM |
Cytosol |
Nucleus |
|
| Expt A |
 6
6
peptides |
10
spectra |
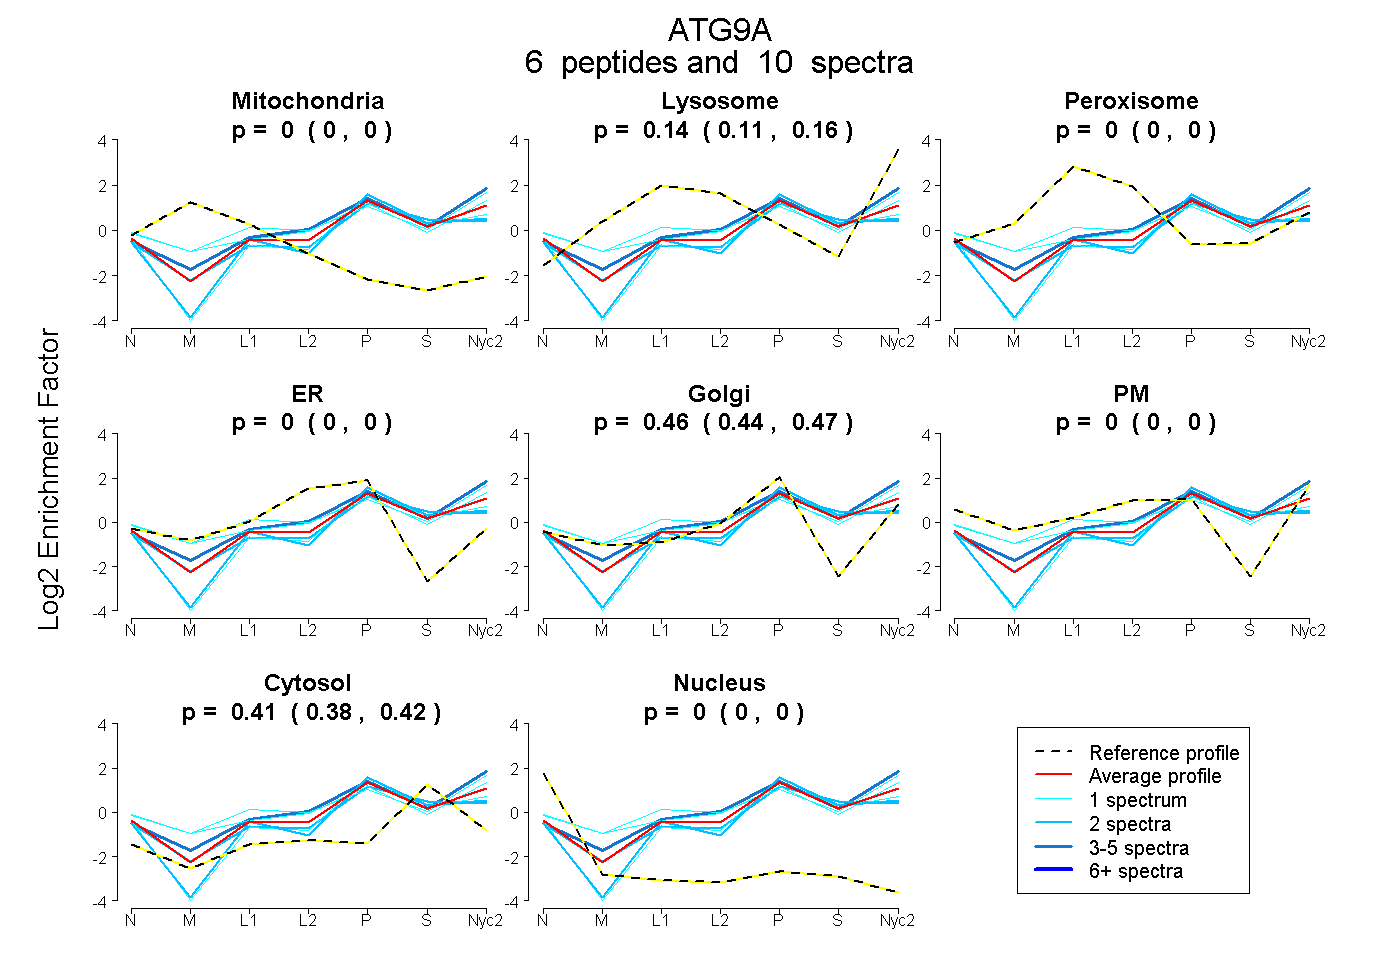 |
0.000
0.000 | 0.000 |
0.137
0.109 | 0.160 |
|
0.000
0.000 | 0.000 |
0.000
0.000 | 0.000 |
0.458
0.441 | 0.472 |
0.000
0.000 | 0.000 |
0.405
0.385 | 0.424 |
0.000
0.000 | 0.000 |
|
| | | Plot |
Mito |
|
Lyso or Perox |
|
ER |
Golgi |
PM |
Cytosol |
Nucleus |
|
| Expt B |
4
peptides |
6
spectra |
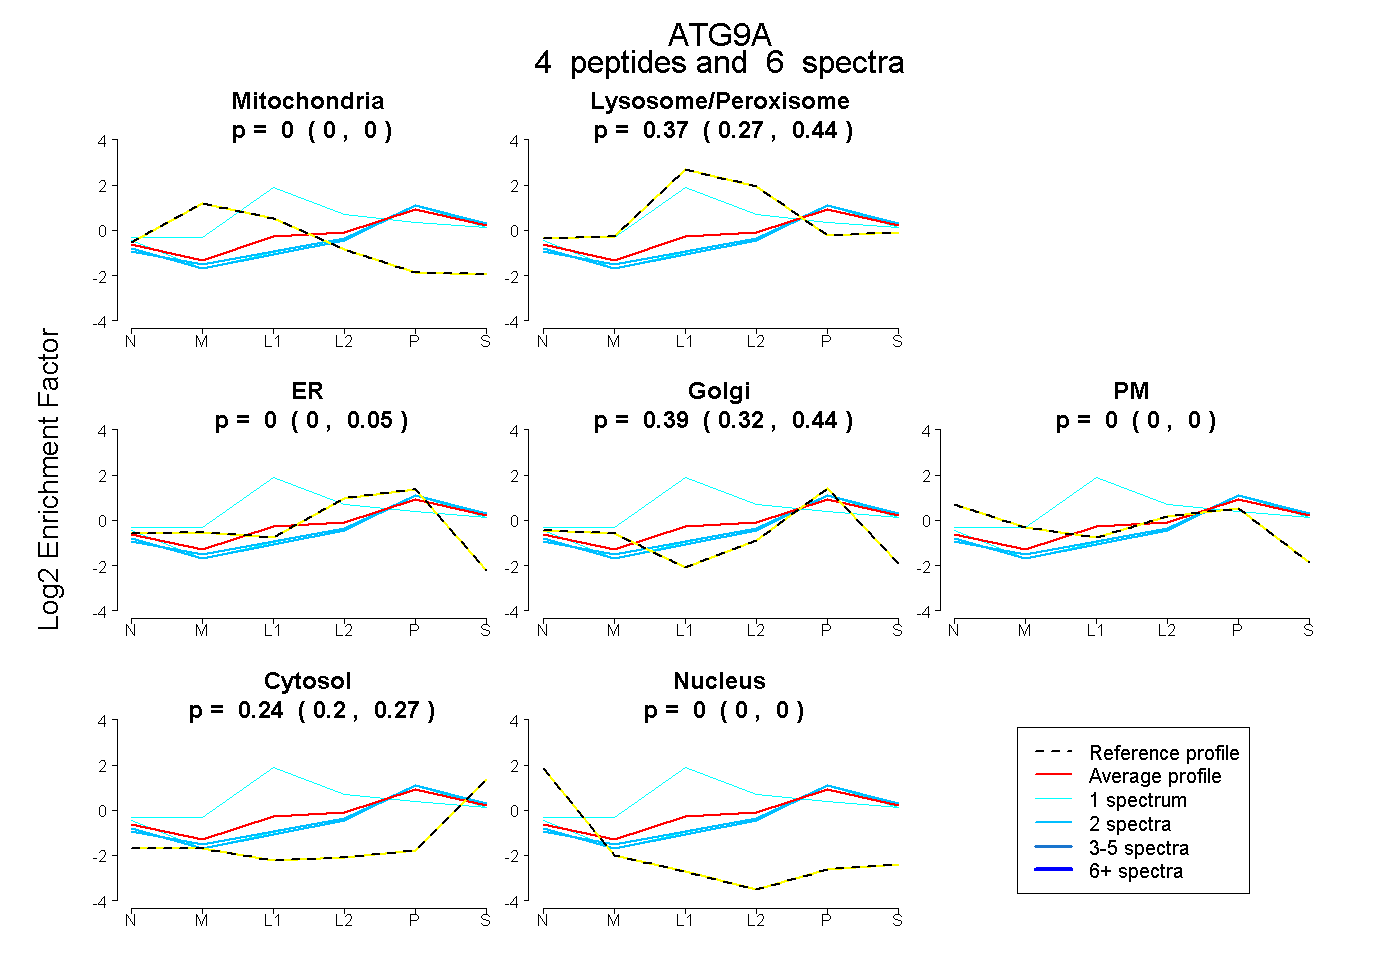 |
0.000
0.000 | 0.000 |
|
0.371
0.270 | 0.436 |
|
0.000
0.000 | 0.047 |
0.394
0.320 | 0.436 |
0.000
0.000 | 0.000 |
0.235
0.199 | 0.270 |
0.000
0.000 | 0.000 |
|
| 2 spectra, SLLPLR |
0.000 |
|
0.220 |
|
0.017 |
0.453 |
0.000 |
0.310 |
0.000 |
|
| 1 spectrum, ALEIIDFFR |
0.000 |
|
0.241 |
|
0.000 |
0.500 |
0.000 |
0.259 |
0.000 |
|
| 2 spectra, HFNELEHELQSR |
0.000 |
|
0.232 |
|
0.056 |
0.407 |
0.000 |
0.305 |
0.000 |
|
| 1 spectrum, VYNLHQK |
0.000 |
|
0.770 |
|
0.000 |
0.152 |
0.000 |
0.078 |
0.000 |
|
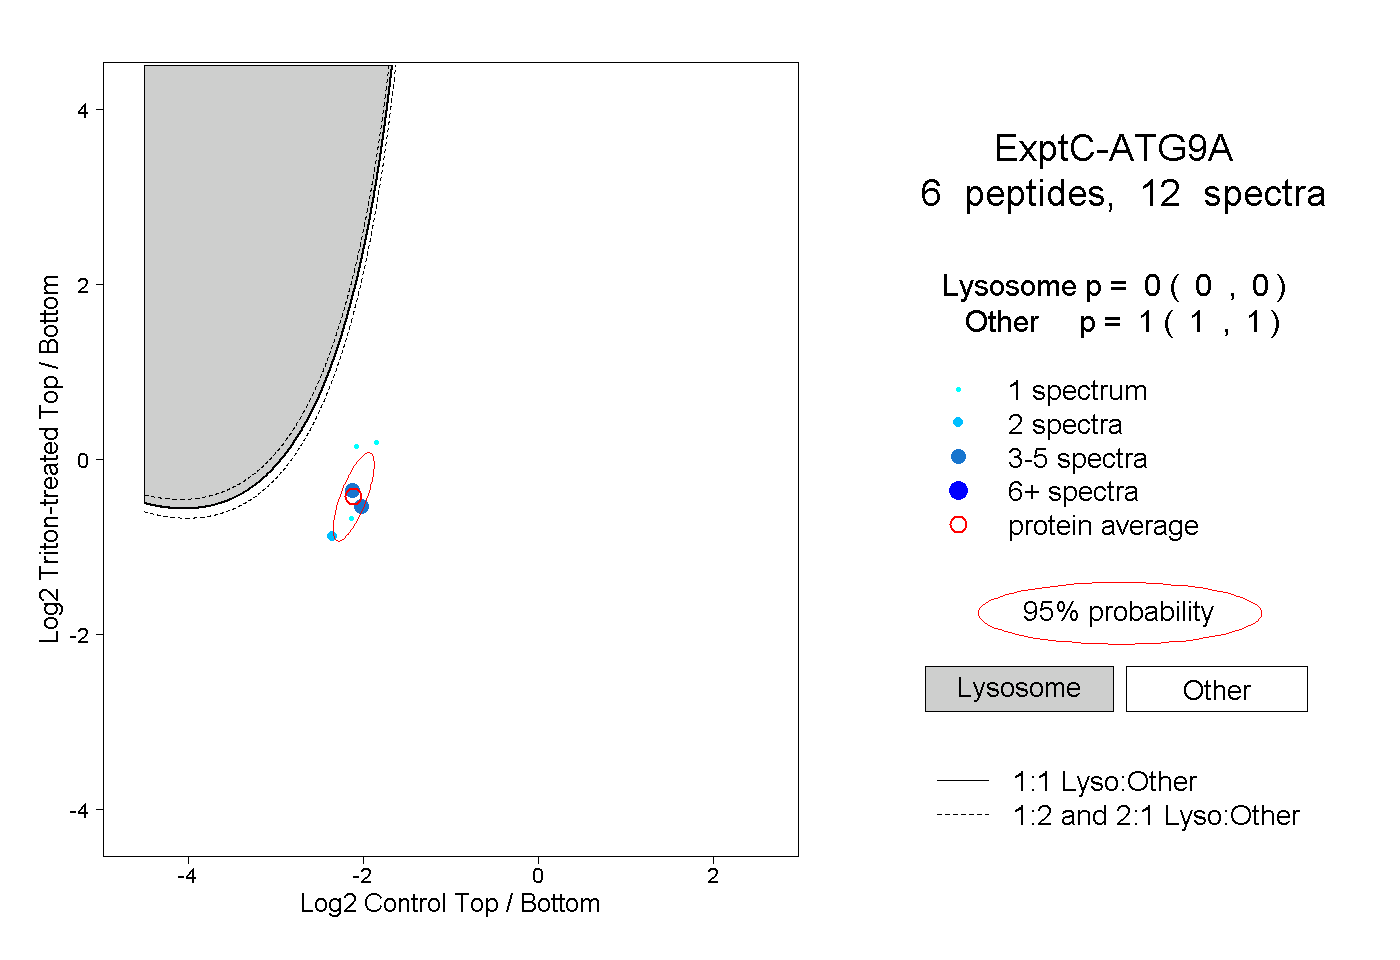
| | | Plot |
|
Lyso |
|
|
|
|
|
|
|
Other |
| Expt C |
6
peptides |
12
spectra |
 |
|
0.000
0.000 | 0.000 |
|
|
|
|
|
|
|
1.000
1.000 | 1.000 |
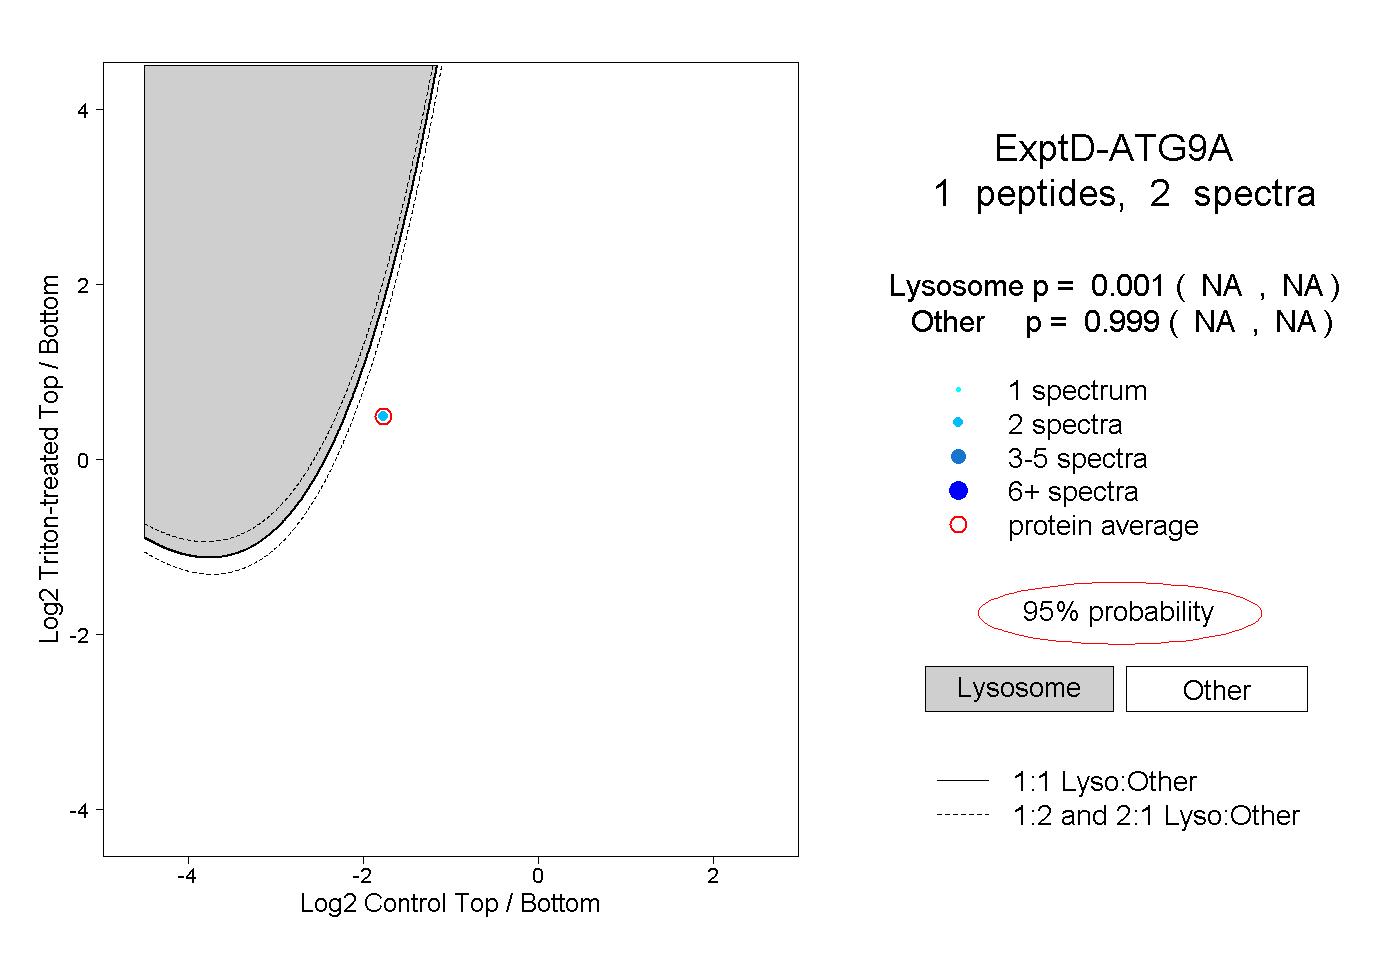
| | | Plot |
|
Lyso |
|
|
|
|
|
|
|
Other |
| Expt D |
1
peptide |
2
spectra |
 |
|
0.001
NA | NA |
|
|
|
|
|
|
|
0.999
NA | NA |