 6
6peptides
spectra
0.000 | 0.000
0.109 | 0.160
0.000 | 0.000
0.000 | 0.000
0.441 | 0.472
0.000 | 0.000
0.385 | 0.424
0.000 | 0.000
| Plot | Mito | Lyso | Perox | ER | Golgi | PM | Cytosol | Nucleus | |||||
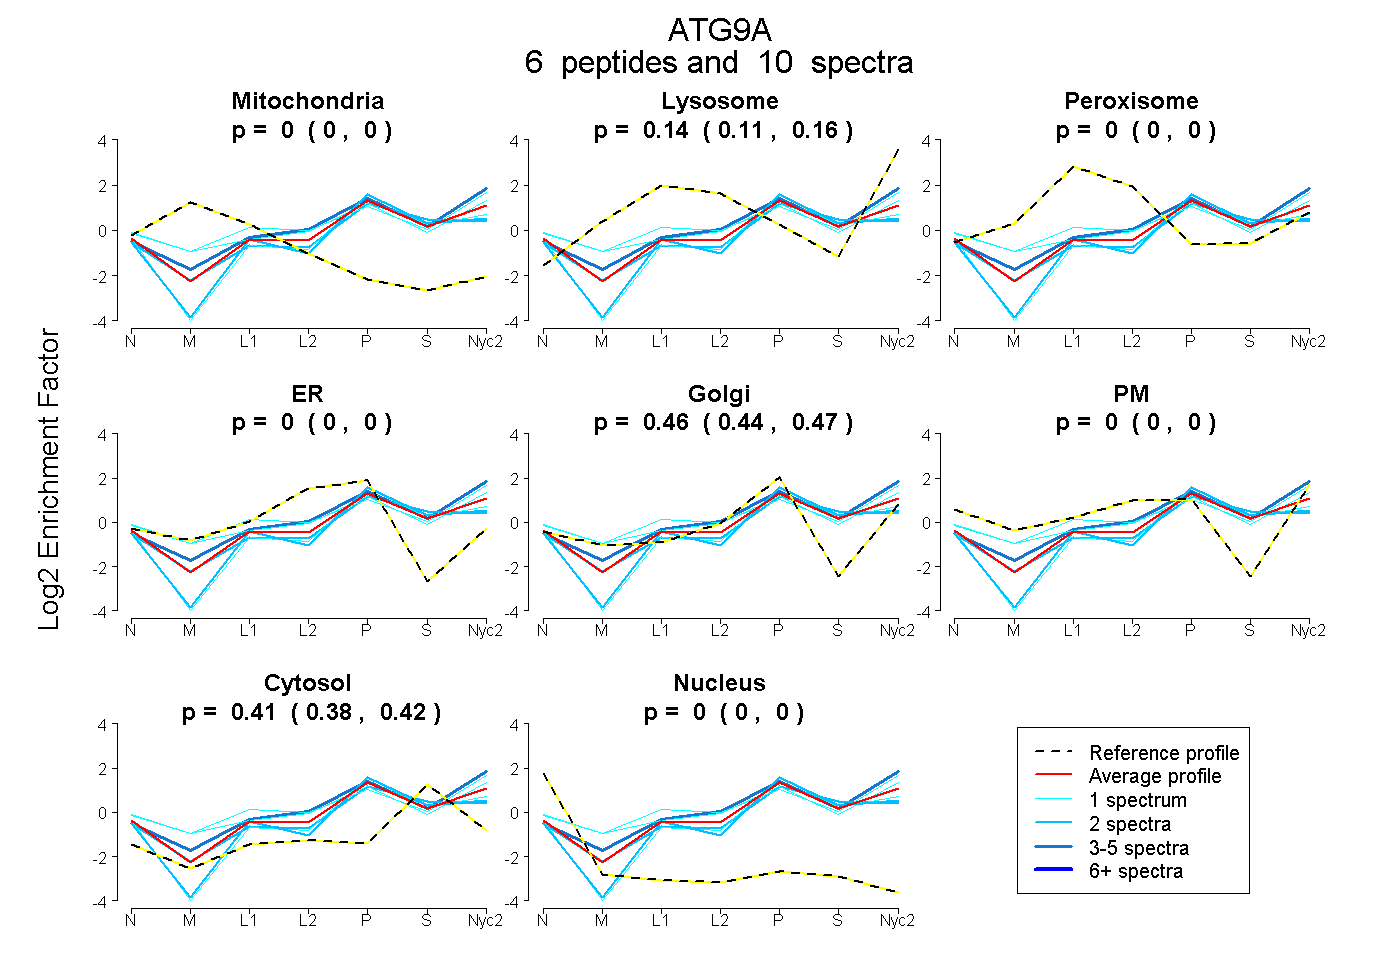
| Expt A |
6 peptides |
10 spectra |
|
0.000 0.000 | 0.000 |
0.137 0.109 | 0.160 |
0.000 0.000 | 0.000 |
0.000 0.000 | 0.000 |
0.458 0.441 | 0.472 |
0.000 0.000 | 0.000 |
0.405 0.385 | 0.424 |
0.000 0.000 | 0.000 |
| 1 spectrum, QQTQAEPER | 0.000 | 0.000 | 0.000 | 0.000 | 0.495 | 0.000 | 0.505 | 0.000 | ||
| 2 spectra, VPSTMTGSGVDAR | 0.000 | 0.000 | 0.000 | 0.000 | 0.477 | 0.000 | 0.523 | 0.000 | ||
| 3 spectra, ALEIIDFFR | 0.000 | 0.291 | 0.000 | 0.000 | 0.398 | 0.000 | 0.311 | 0.000 | ||
| 1 spectrum, HFNELEHELQSR | 0.000 | 0.180 | 0.000 | 0.000 | 0.295 | 0.221 | 0.305 | 0.000 | ||
| 2 spectra, APQPIPR | 0.000 | 0.045 | 0.000 | 0.000 | 0.447 | 0.000 | 0.508 | 0.000 | ||
| 1 spectrum, VYNLHQK | 0.000 | 0.270 | 0.000 | 0.000 | 0.160 | 0.261 | 0.309 | 0.000 |
| Plot | Mito | Lyso or Perox | ER | Golgi | PM | Cytosol | Nucleus | ||||||
| Expt B |
4 peptides |
6 spectra |
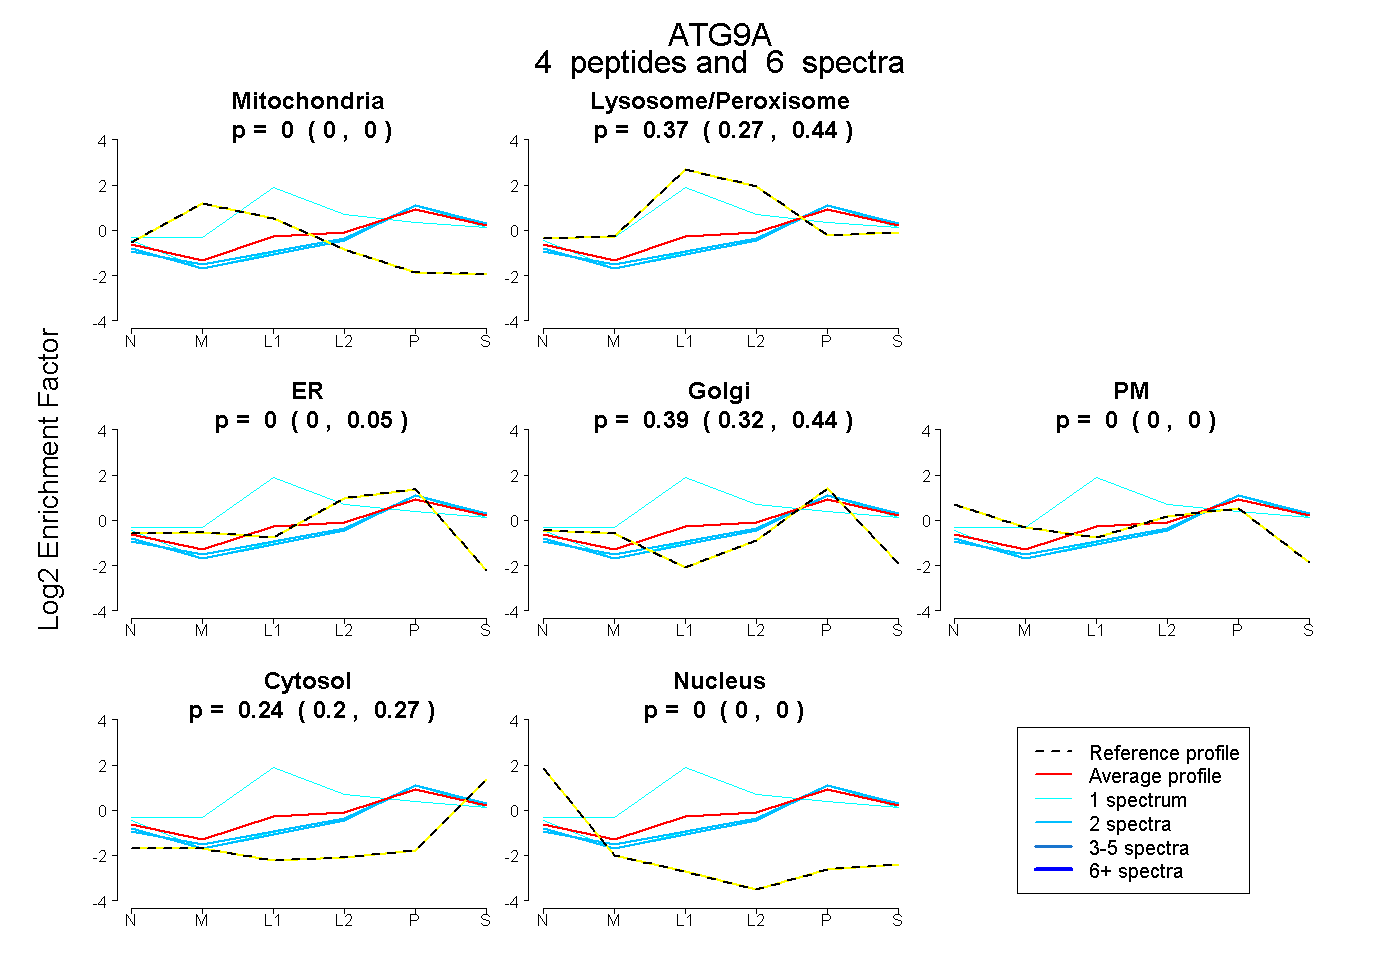 |
0.000 0.000 | 0.000 |
0.371 0.270 | 0.436 |
0.000 0.000 | 0.047 |
0.394 0.320 | 0.436 |
0.000 0.000 | 0.000 |
0.235 0.199 | 0.270 |
0.000 0.000 | 0.000 |
|||
| Plot | Lyso | Other | |||||||||||
| Expt C |
6 peptides |
12 spectra |
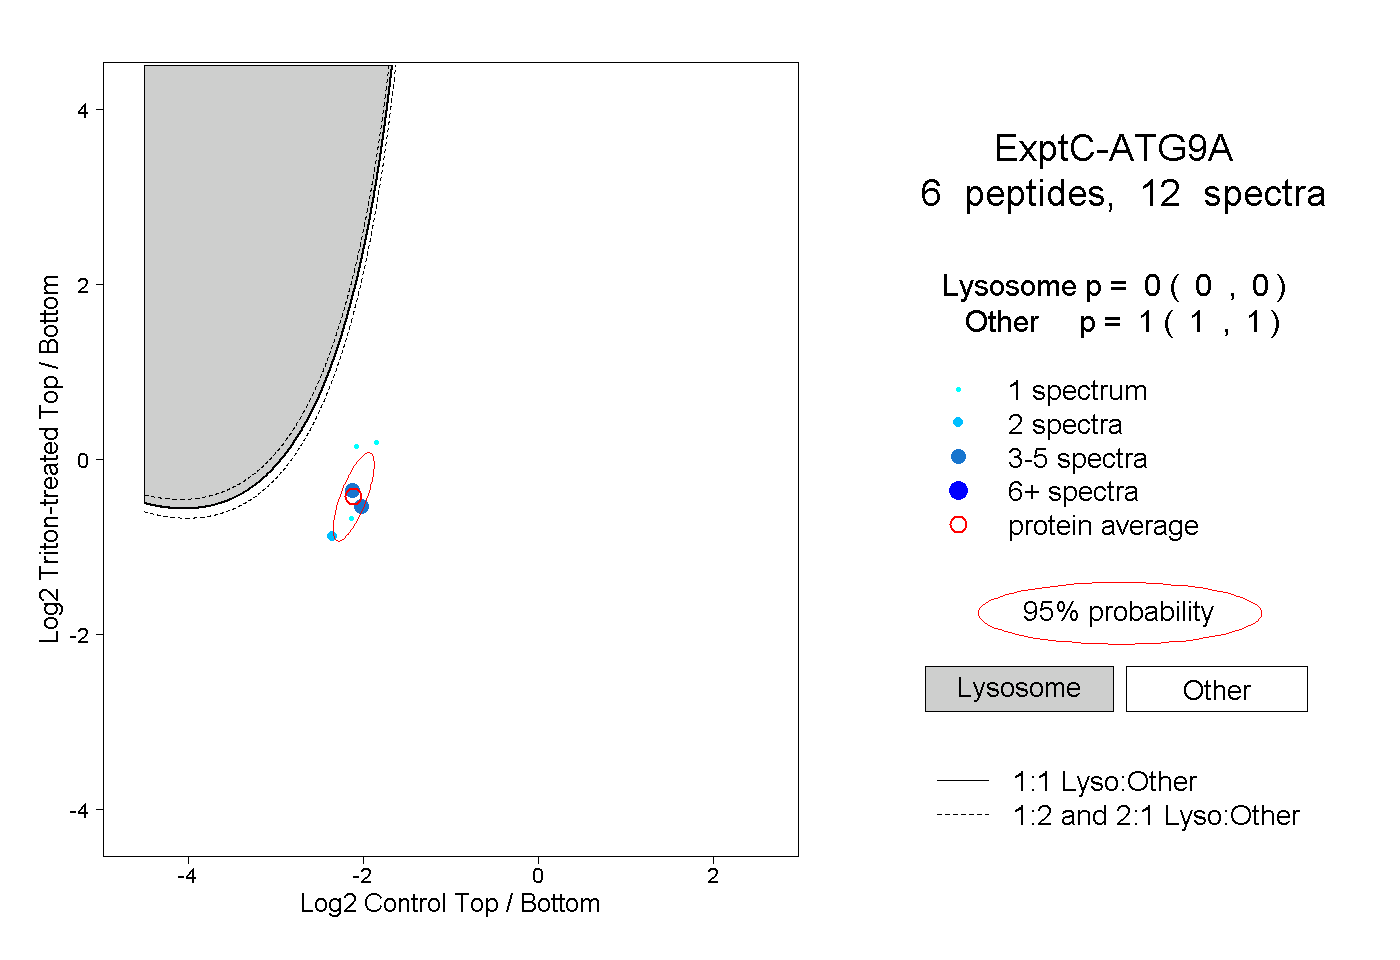 |
0.000 0.000 | 0.000 |
1.000 1.000 | 1.000 |
||||||||
| Plot | Lyso | Other | |||||||||||
| Expt D |
1 peptide |
2 spectra |
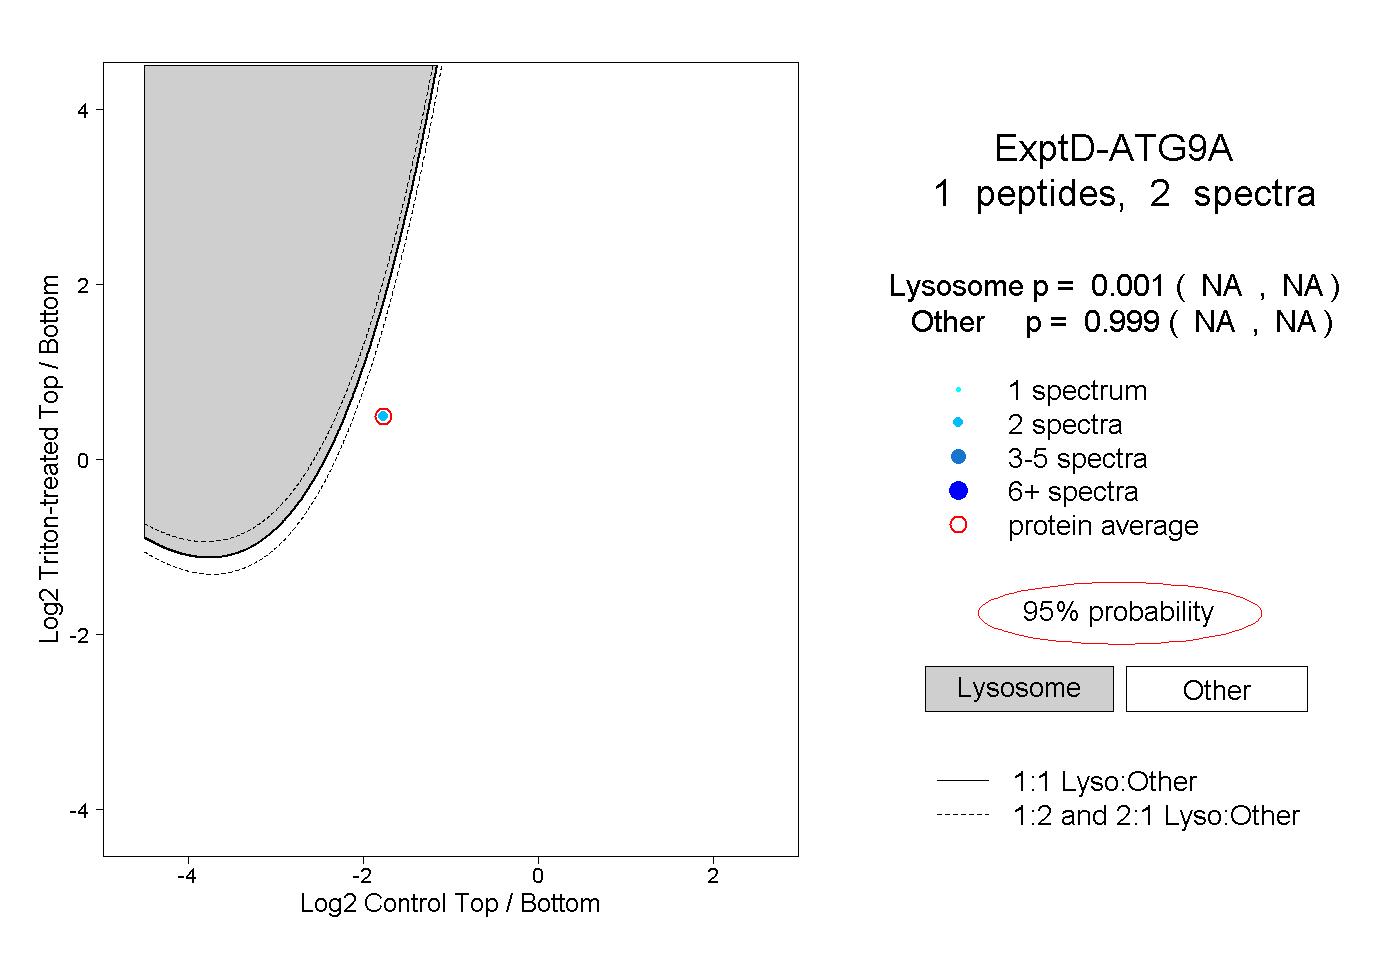 |
0.001 NA | NA |
0.999 NA | NA |