 6
6peptides
spectra
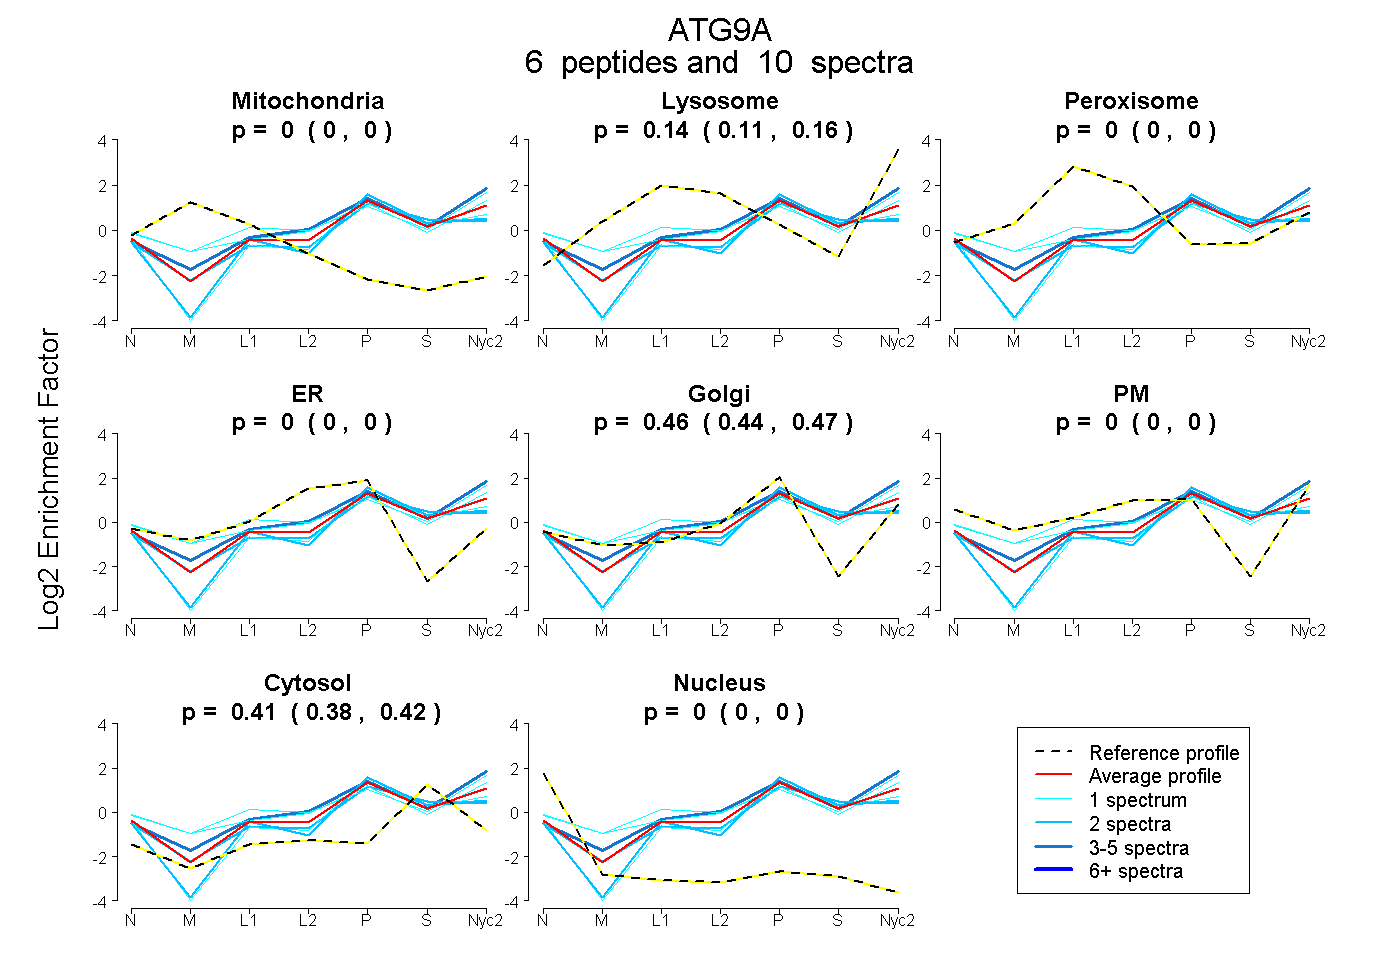
0.000 | 0.000
0.109 | 0.160
0.000 | 0.000
0.000 | 0.000
0.441 | 0.472
0.000 | 0.000
0.385 | 0.424
0.000 | 0.000
4peptides
spectra
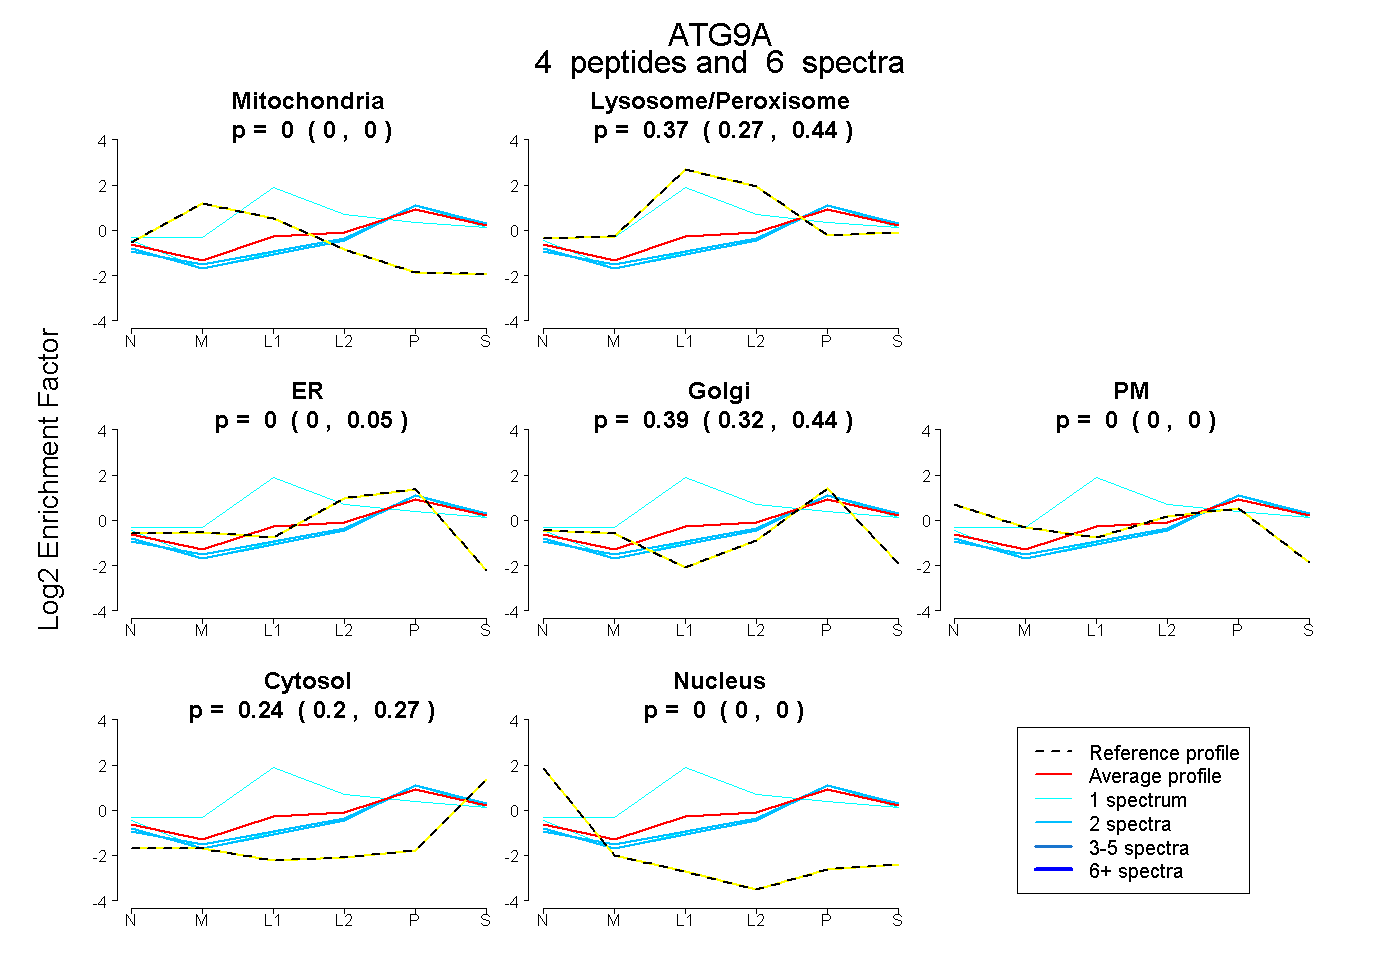
0.000 | 0.000
0.270 | 0.436
0.000 | 0.047
0.320 | 0.436
0.000 | 0.000
0.199 | 0.270
0.000 | 0.000
6peptides
spectra
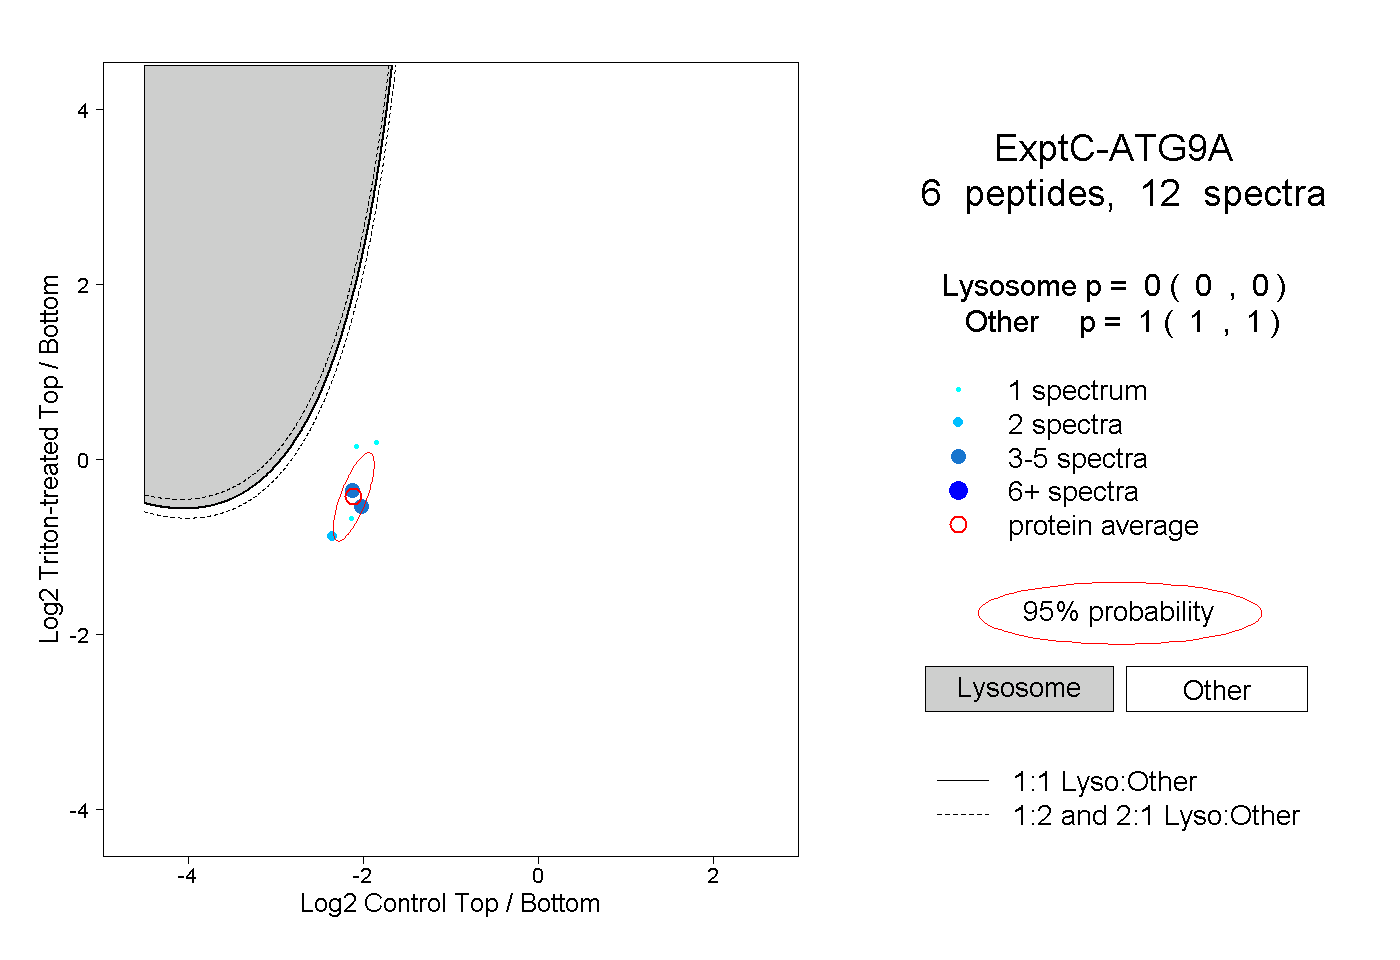
0.000 | 0.000
1.000 | 1.000
1peptide
spectra
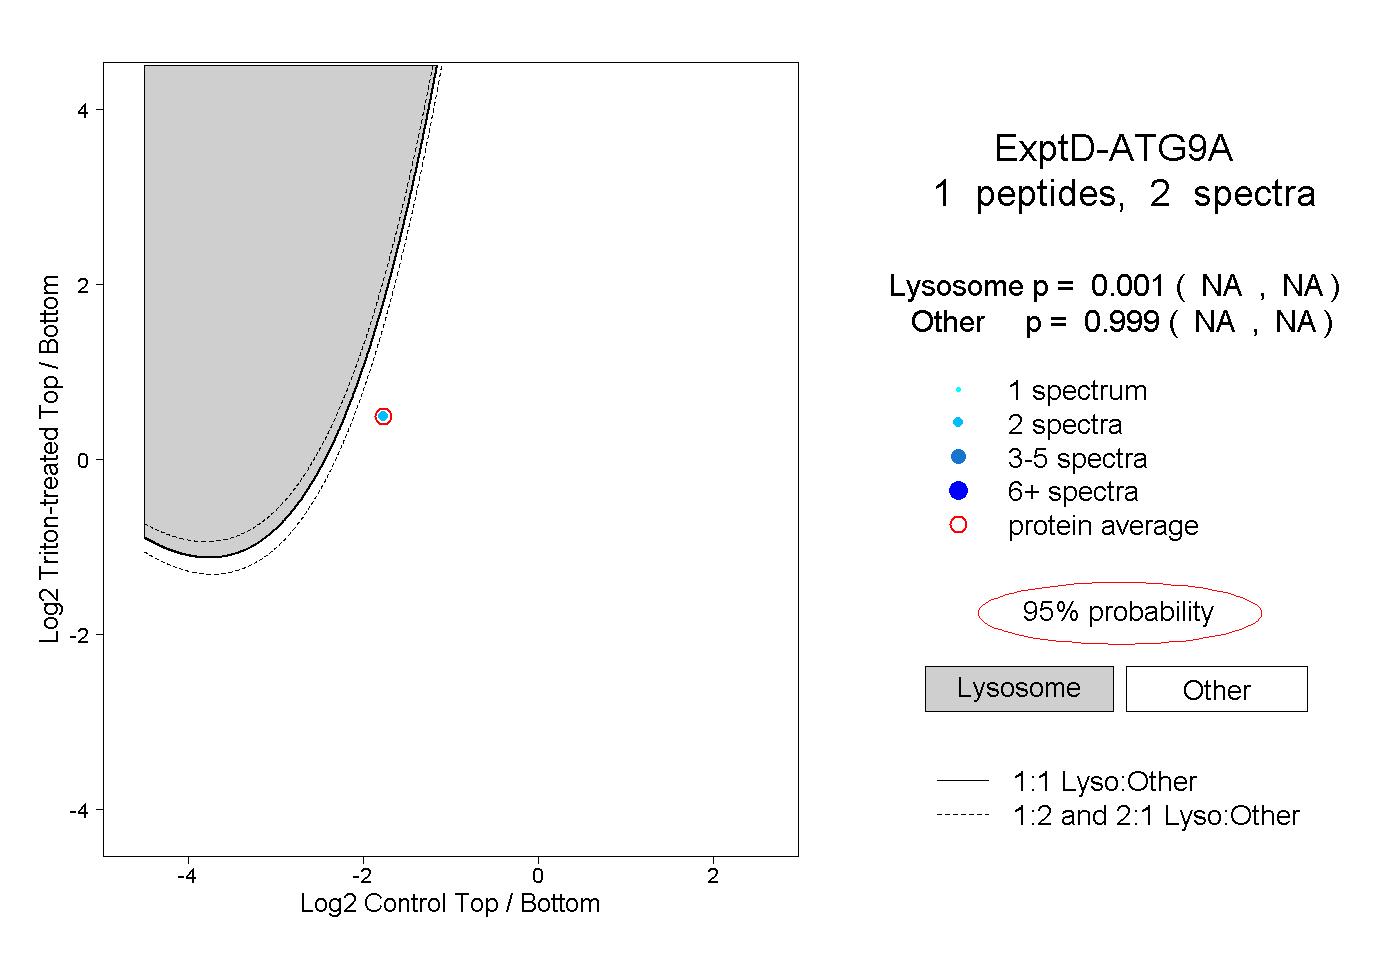
NA | NA
NA | NA