 5
5peptides
spectra
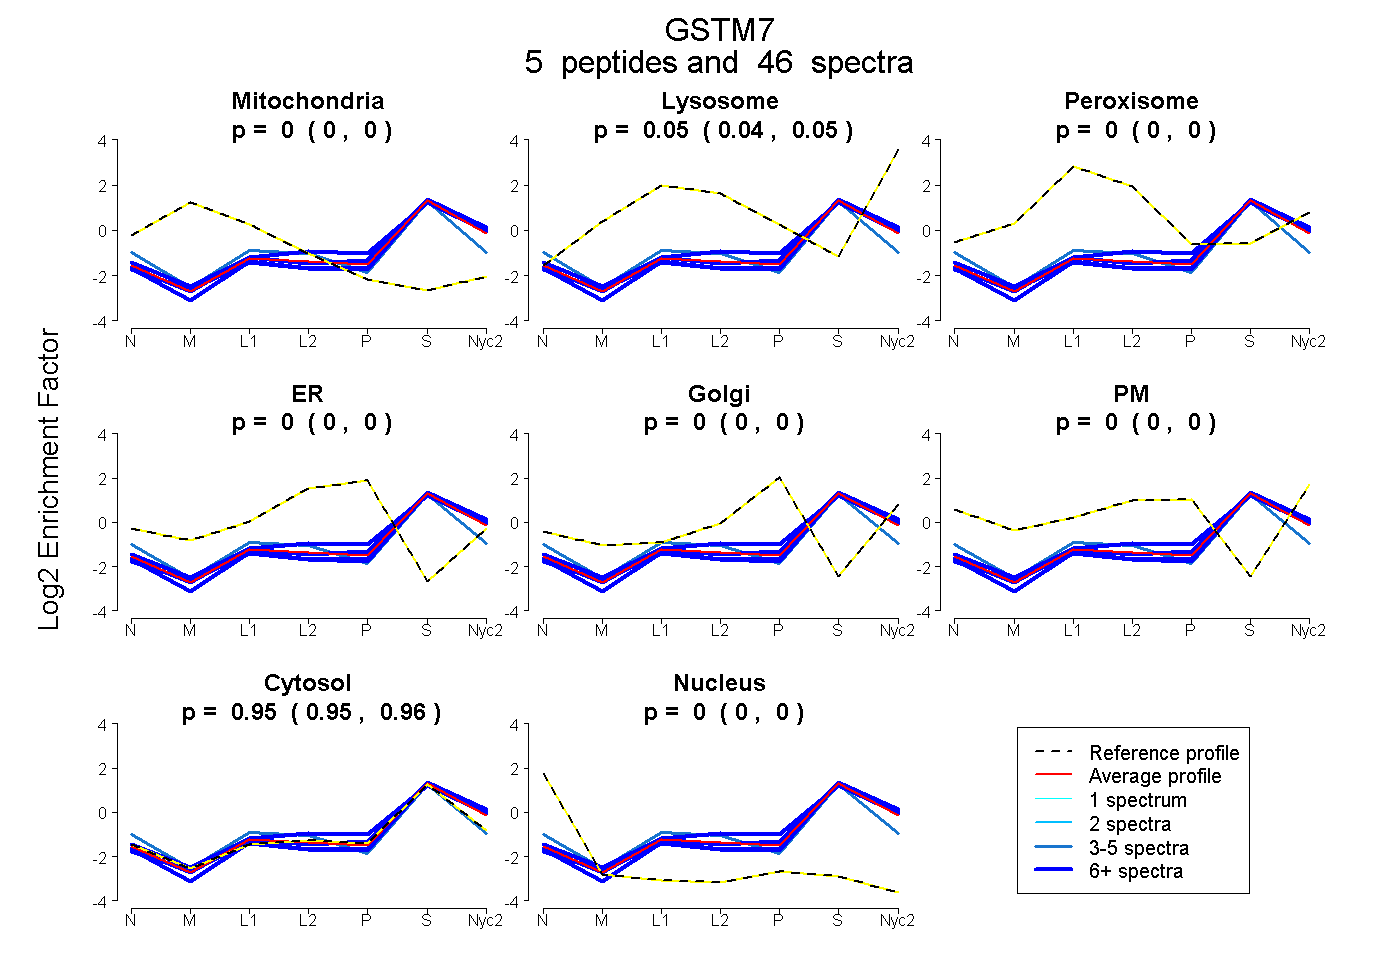
0.000 | 0.000
0.040 | 0.050
0.000 | 0.000
0.000 | 0.000
0.000 | 0.000
0.000 | 0.000
0.949 | 0.959
0.000 | 0.000
2peptides
spectra
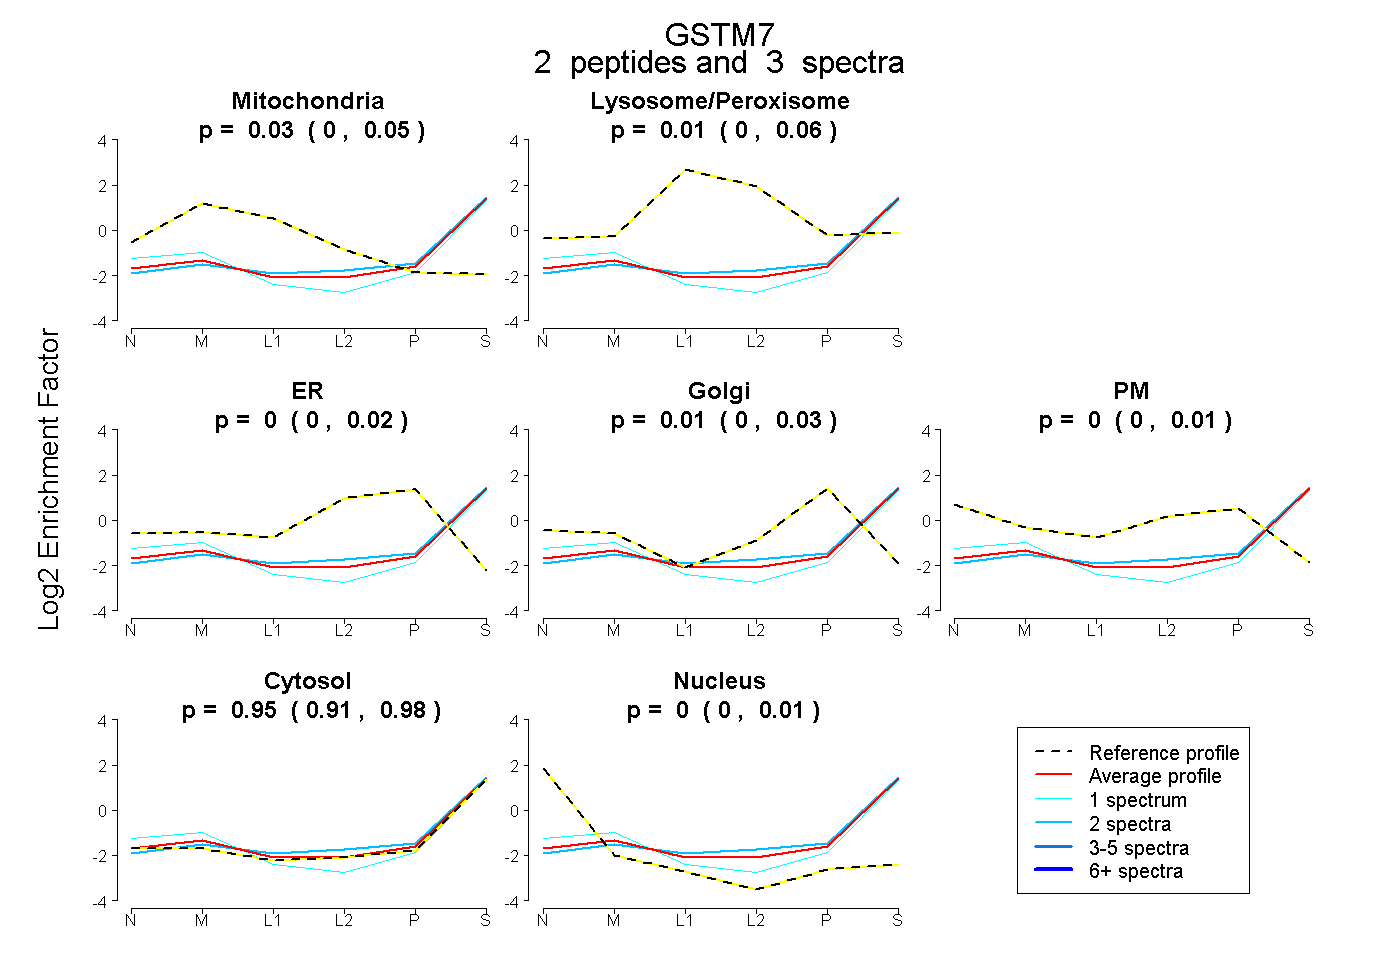
0.000 | 0.055
0.000 | 0.065
0.000 | 0.021
0.000 | 0.029
0.000 | 0.010
0.908 | 0.981
0.000 | 0.009
7peptides
spectra
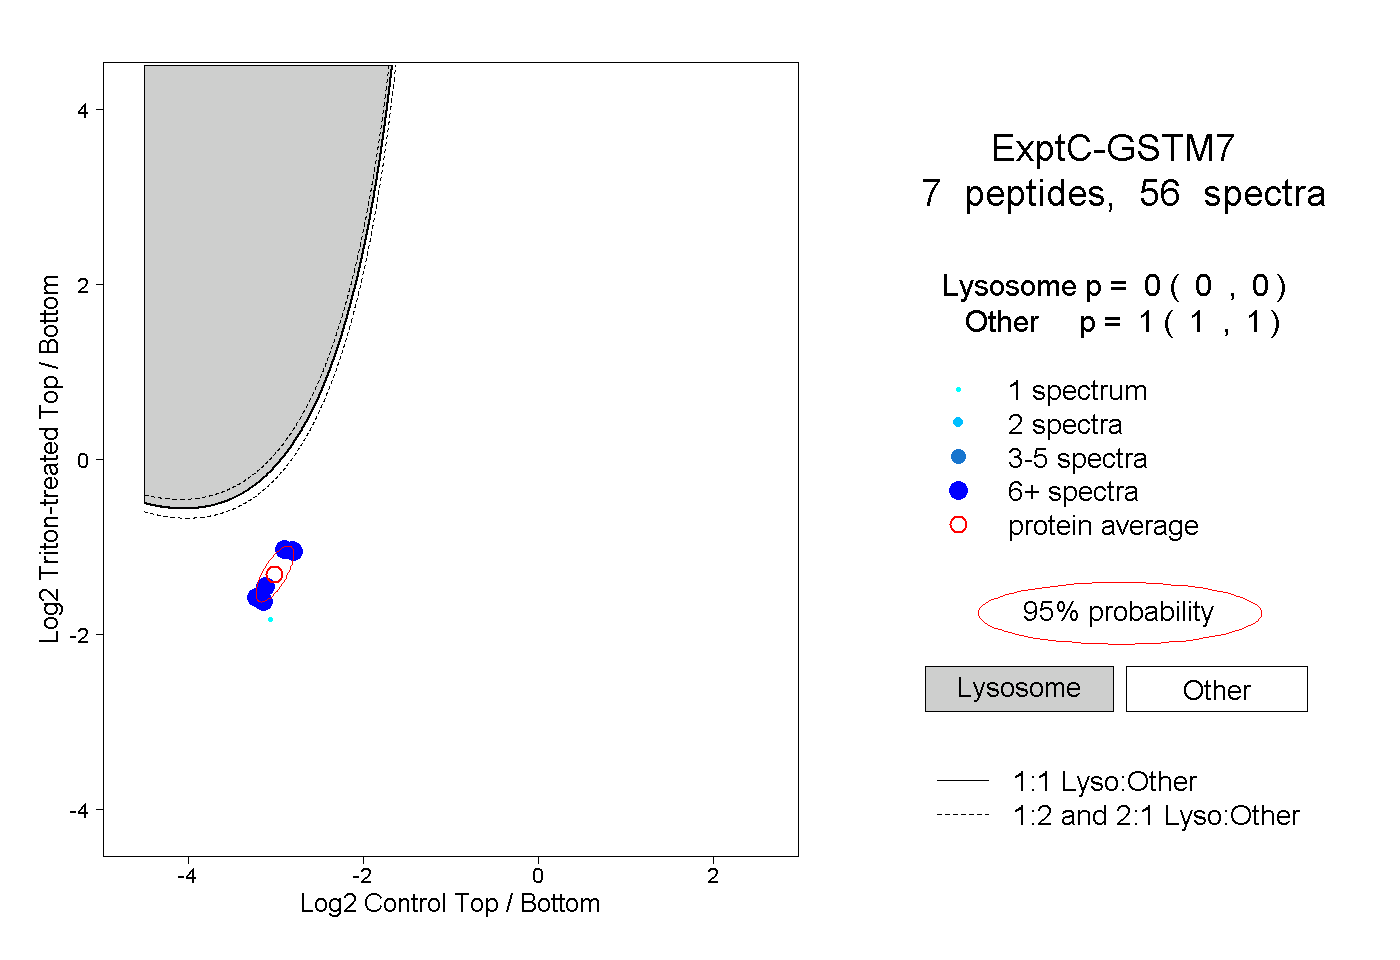
0.000 | 0.000
1.000 | 1.000