 3
3peptides
spectra
0.000 | 0.000
0.000 | 0.000
0.000 | 0.003
0.039 | 0.185
0.000 | 0.161
0.119 | 0.288
0.546 | 0.619
0.000 | 0.000
1peptide
spectra
NA | NA
NA | NA
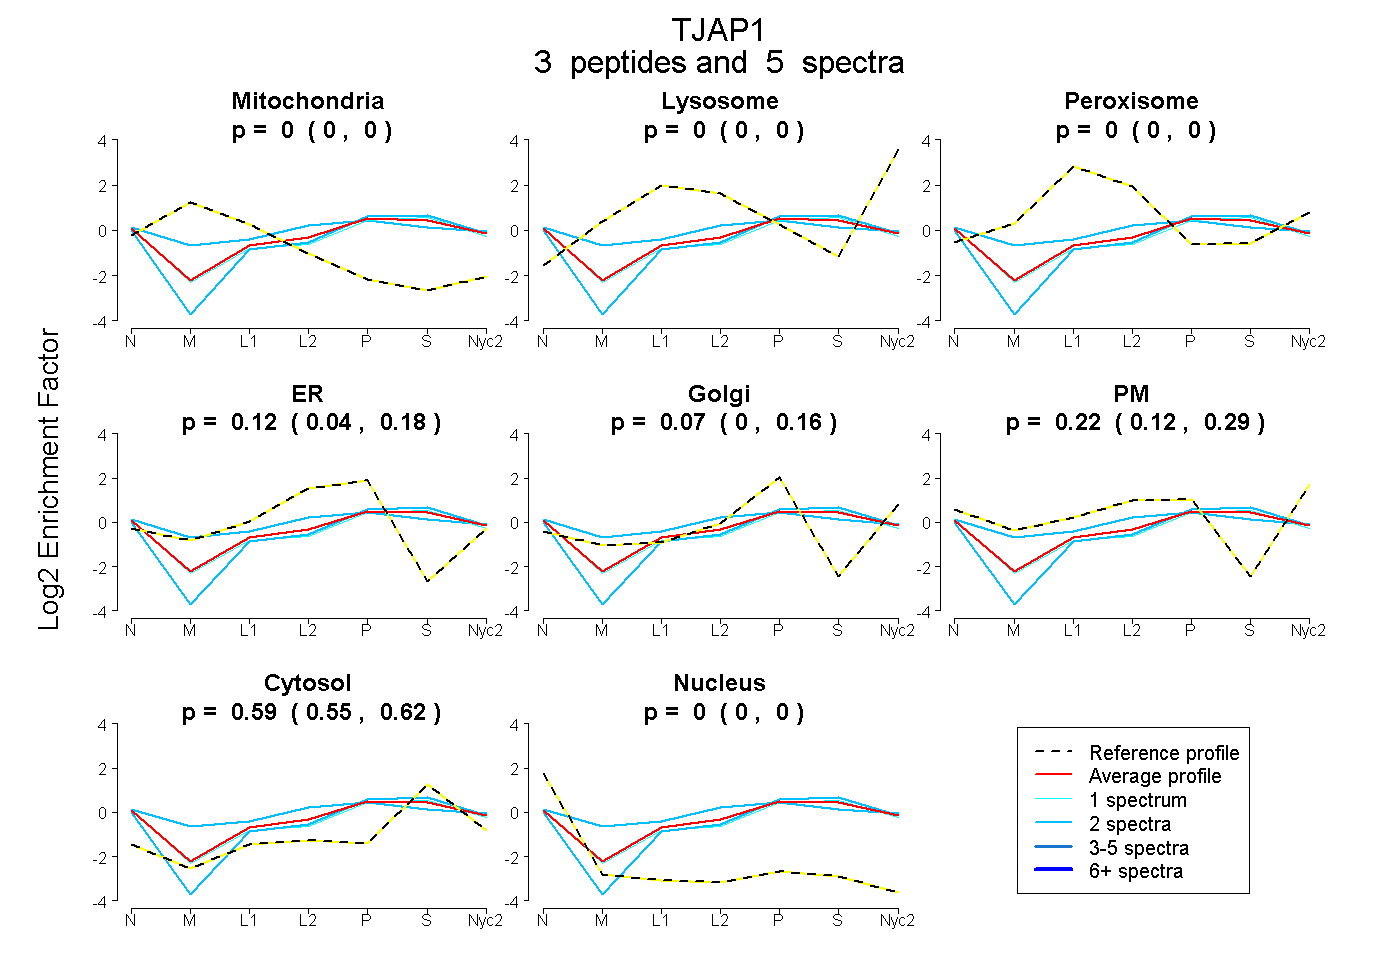
| Plot | Mito | Lyso | Perox | ER | Golgi | PM | Cytosol | Nucleus | |||||
| Expt A |
3 peptides |
5 spectra |
|
0.000 0.000 | 0.000 |
0.000 0.000 | 0.000 |
0.000 0.000 | 0.003 |
0.123 0.039 | 0.185 |
0.069 0.000 | 0.161 |
0.219 0.119 | 0.288 |
0.589 0.546 | 0.619 |
0.000 0.000 | 0.000 |
||
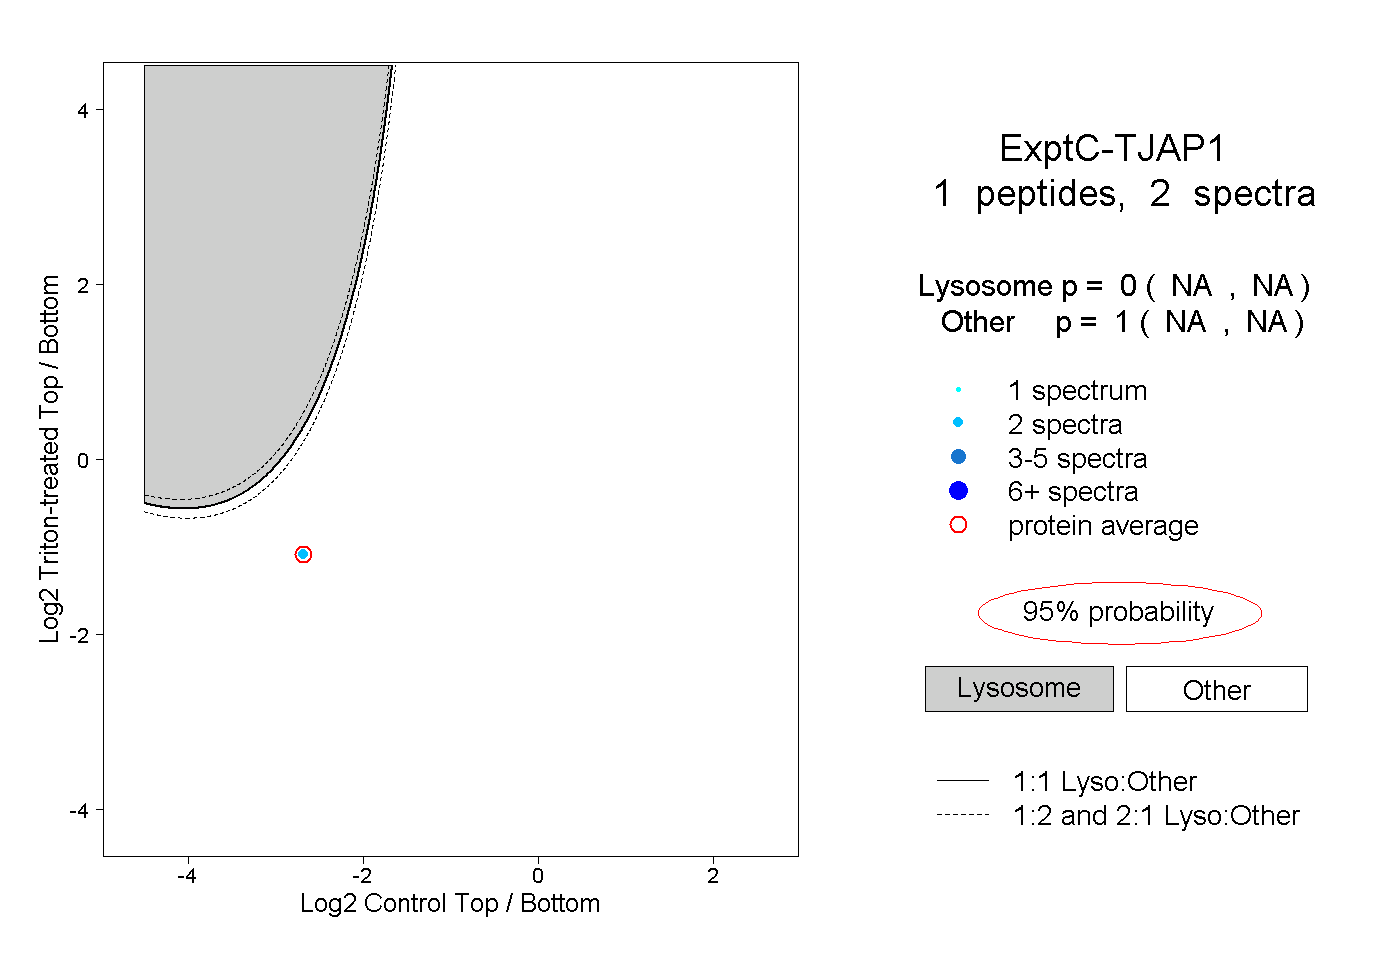
| Plot | Lyso | Other | |||||||||||
| Expt C |
1 peptide |
2 spectra |
|
0.000 NA | NA |
1.000 NA | NA |