GSS
[ENSRNOP00000025657]
Main page
| | | Plot |
Mito |
Lyso |
|
Perox |
ER |
Golgi |
PM |
Cytosol |
Nucleus |
|
| Expt A |
 21
21
peptides |
73
spectra |
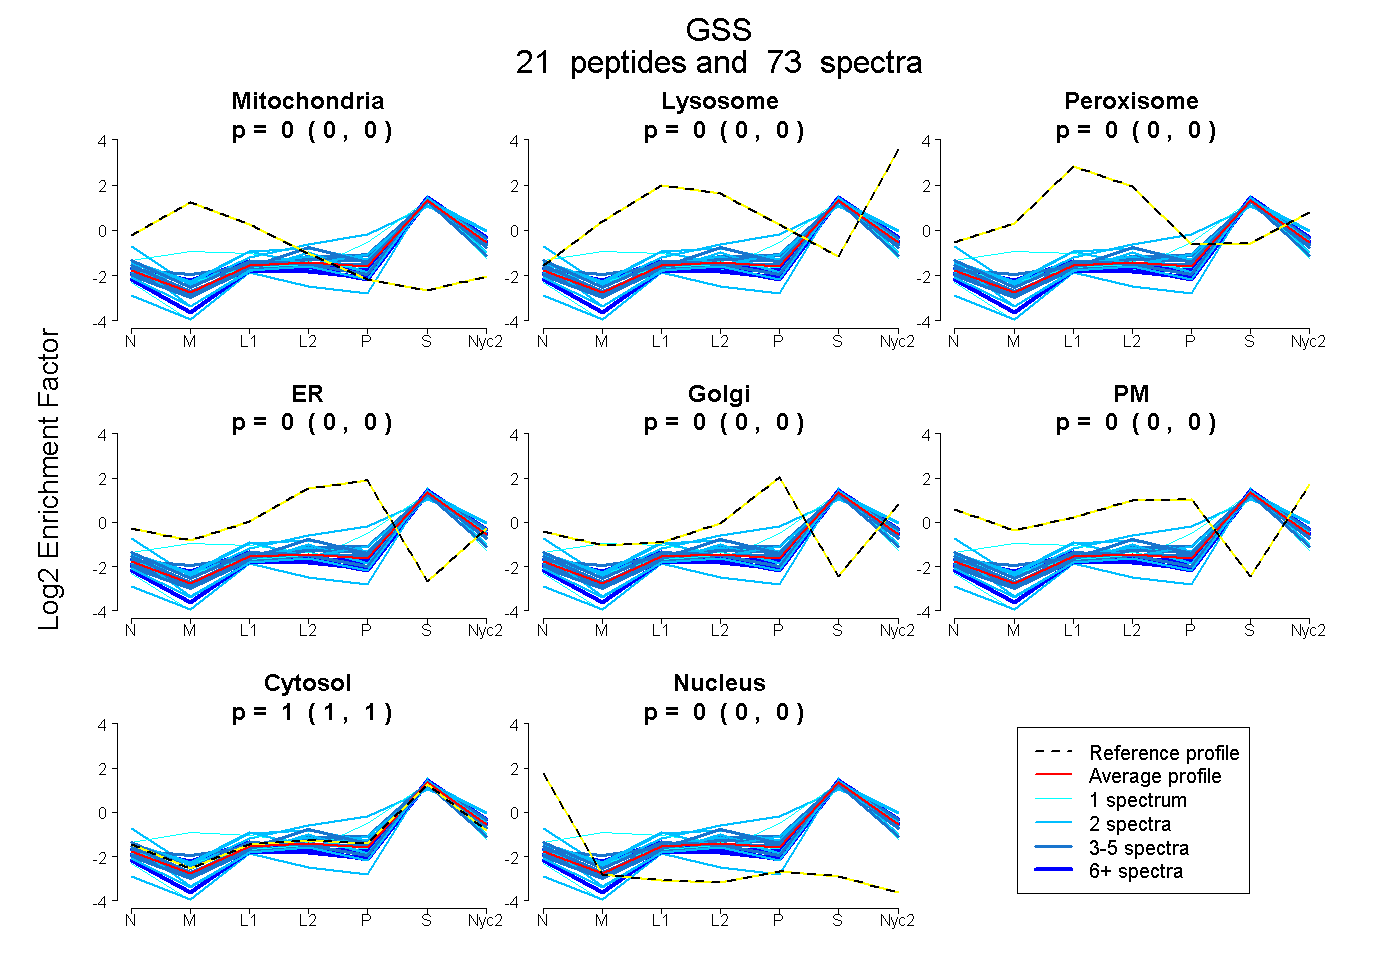 |
0.000
0.000 | 0.000 |
0.000
0.000 | 0.000 |
|
0.000
0.000 | 0.000 |
0.000
0.000 | 0.000 |
0.000
0.000 | 0.000 |
0.000
0.000 | 0.000 |
1.000
1.000 | 1.000 |
0.000
0.000 | 0.000 |
|
| | | Plot |
Mito |
|
Lyso or Perox |
|
ER |
Golgi |
PM |
Cytosol |
Nucleus |
|
| Expt B |
10
peptides |
17
spectra |
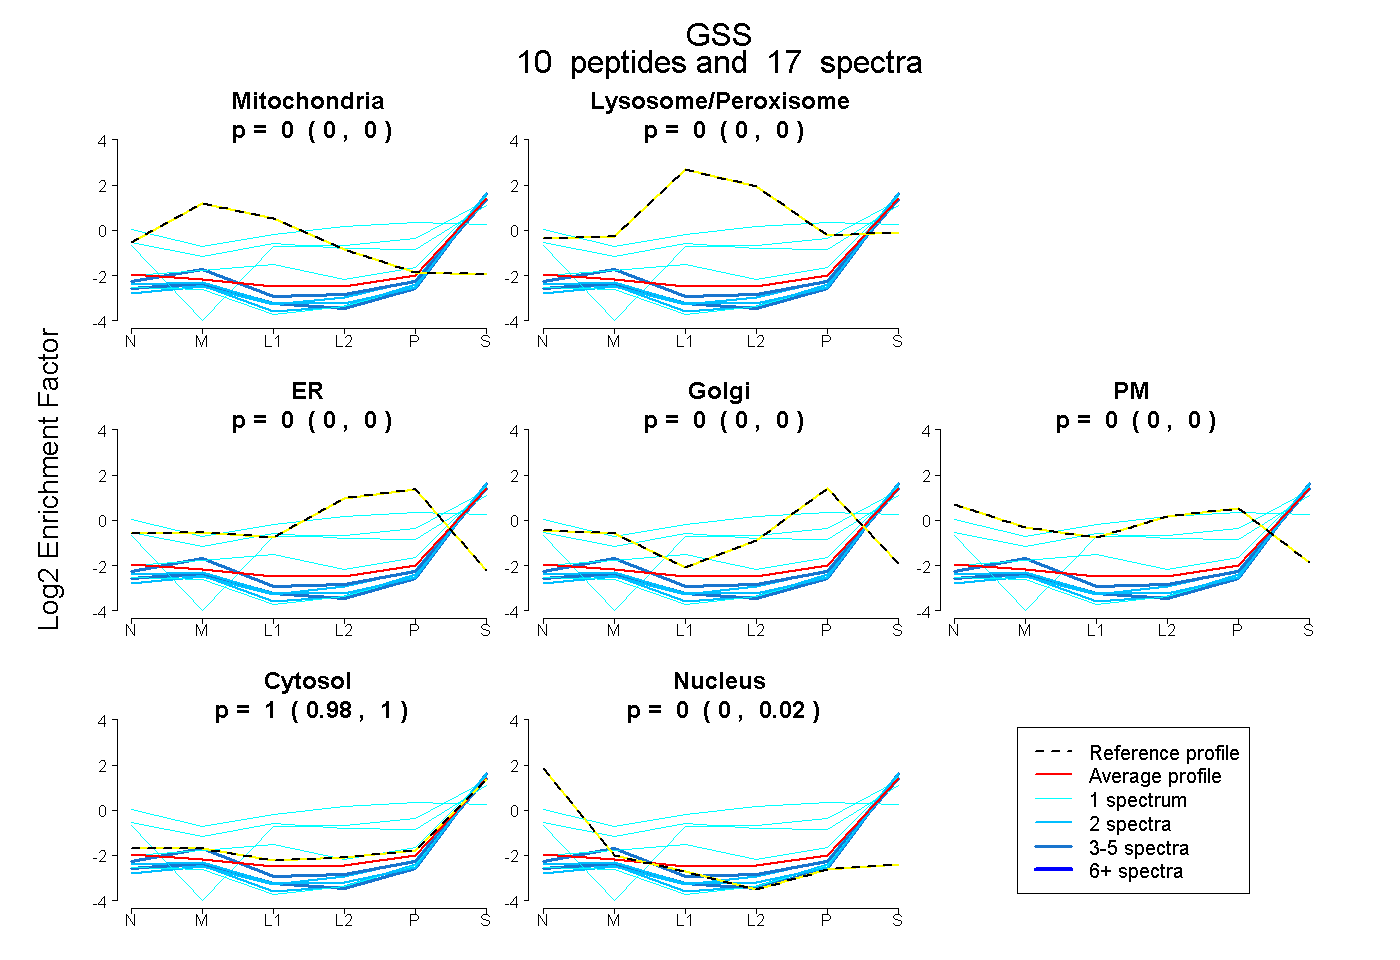 |
0.000
0.000 | 0.000 |
|
0.000
0.000 | 0.000 |
|
0.000
0.000 | 0.000 |
0.000
0.000 | 0.000 |
0.000
0.000 | 0.000 |
0.999
0.977 | 1.000 |
0.001
0.000 | 0.019 |
|
| | | Plot |
|
Lyso |
|
|
|
|
|
|
|
Other |
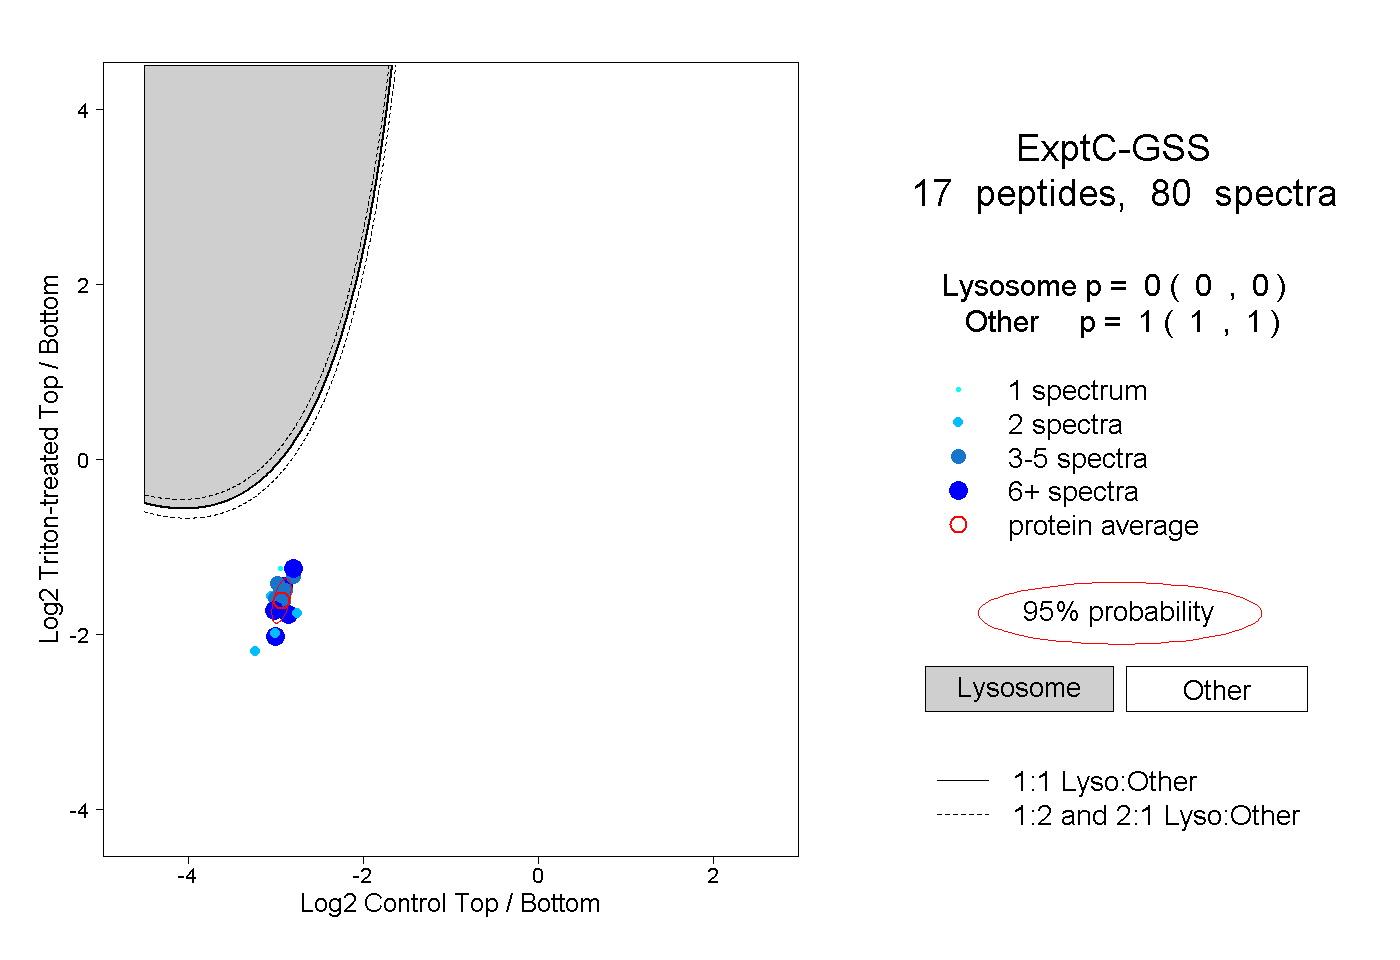
| Expt C |
17
peptides |
80
spectra |
 |
|
0.000
0.000 | 0.000 |
|
|
|
|
|
|
|
1.000
1.000 | 1.000 |
| 4 spectra, NIFDQR |
|
0.000 |
|
|
|
|
|
|
|
1.000 |
| 8 spectra, AIENELLDR |
|
0.000 |
|
|
|
|
|
|
|
1.000 |
| 2 spectra, SDYMFQCSADGSK |
|
0.000 |
|
|
|
|
|
|
|
1.000 |
| 8 spectra, IEPEPFR |
|
0.000 |
|
|
|
|
|
|
|
1.000 |
| 4 spectra, LFDLYK |
|
0.000 |
|
|
|
|
|
|
|
1.000 |
| 2 spectra, IHVIR |
|
0.000 |
|
|
|
|
|
|
|
1.000 |
| 4 spectra, ILSNNPSK |
|
0.000 |
|
|
|
|
|
|
|
1.000 |
| 5 spectra, TPAVHR |
|
0.000 |
|
|
|
|
|
|
|
1.000 |
| 10 spectra, VQQELSR |
|
0.000 |
|
|
|
|
|
|
|
1.000 |
| 2 spectra, GSLDQNR |
|
0.000 |
|
|
|
|
|
|
|
1.000 |
| 6 spectra, QGTTLVMNK |
|
0.000 |
|
|
|
|
|
|
|
1.000 |
| 7 spectra, TNEASK |
|
0.000 |
|
|
|
|
|
|
|
1.000 |
| 4 spectra, FEDVSER |
|
0.000 |
|
|
|
|
|
|
|
1.000 |
| 2 spectra, HVGHLLR |
|
0.000 |
|
|
|
|
|
|
|
1.000 |
| 7 spectra, ALAEGVLLR |
|
0.000 |
|
|
|
|
|
|
|
1.000 |
| 4 spectra, HVLNVLNK |
|
0.000 |
|
|
|
|
|
|
|
1.000 |
| 1 spectrum, GLALGIAK |
|
0.000 |
|
|
|
|
|
|
|
1.000 |
| | | Plot |
|
Lyso |
|
|
|
|
|
|
|
Other |
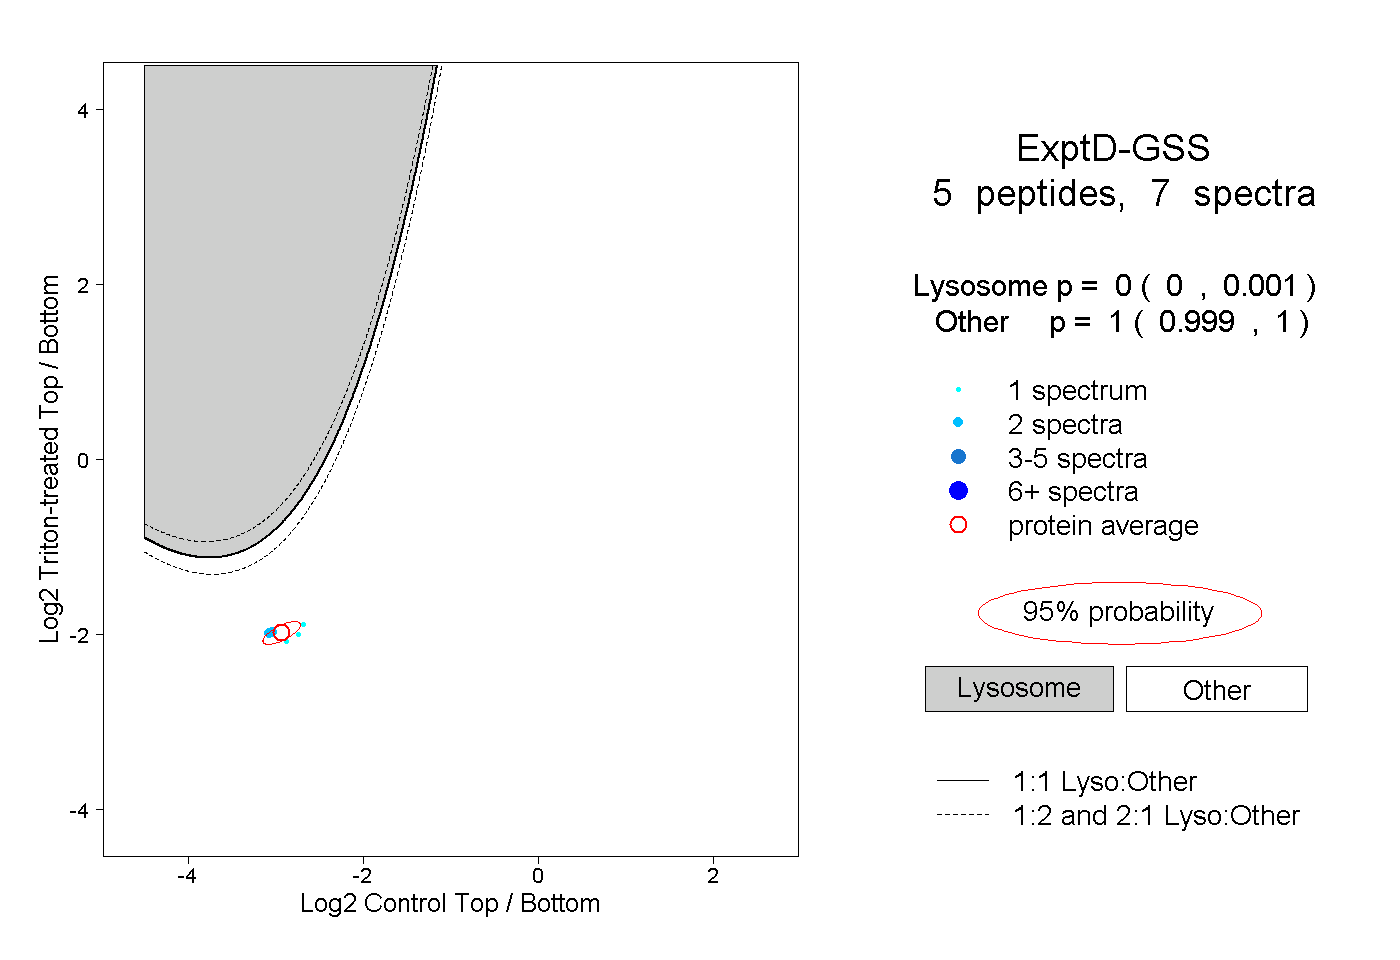
| Expt D |
5
peptides |
7
spectra |
 |
|
0.000
0.000 | 0.001 |
|
|
|
|
|
|
|
1.000
0.999 | 1.000 |