 21
21peptides
spectra
0.000 | 0.000
0.000 | 0.000
0.000 | 0.000
0.000 | 0.000
0.000 | 0.000
0.000 | 0.000
1.000 | 1.000
0.000 | 0.000
| Plot | Mito | Lyso | Perox | ER | Golgi | PM | Cytosol | Nucleus | |||||
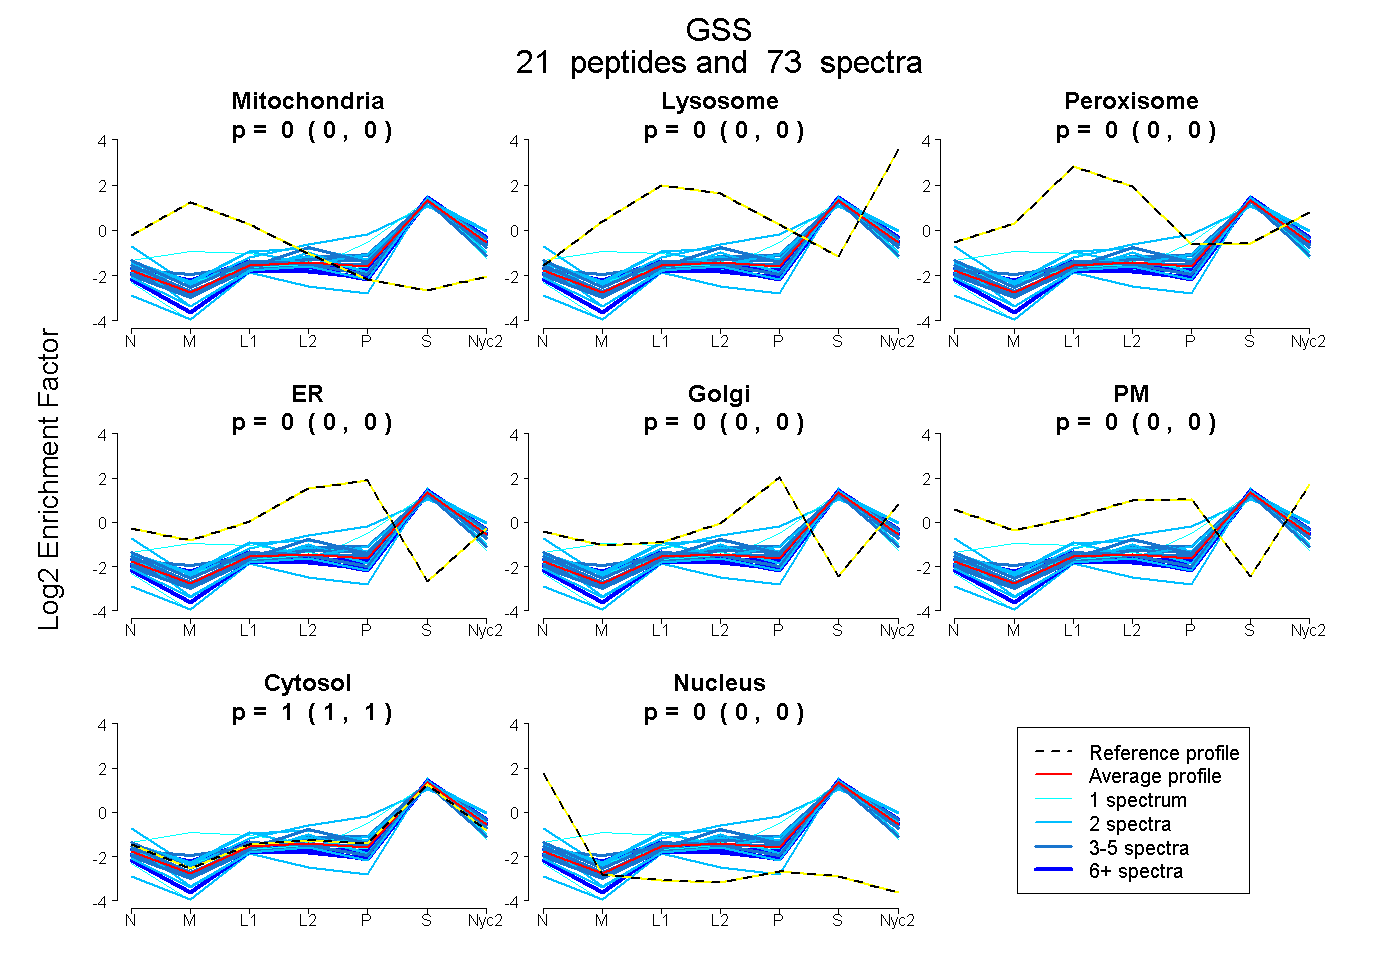
| Expt A |
21 peptides |
73 spectra |
|
0.000 0.000 | 0.000 |
0.000 0.000 | 0.000 |
0.000 0.000 | 0.000 |
0.000 0.000 | 0.000 |
0.000 0.000 | 0.000 |
0.000 0.000 | 0.000 |
1.000 1.000 | 1.000 |
0.000 0.000 | 0.000 |
| 1 spectrum, NIFDQR | 0.000 | 0.000 | 0.000 | 0.000 | 0.000 | 0.000 | 1.000 | 0.000 | ||
| 5 spectra, ASYILMEK | 0.000 | 0.005 | 0.000 | 0.000 | 0.016 | 0.000 | 0.979 | 0.000 | ||
| 1 spectrum, CPDIATQLAGTK | 0.000 | 0.000 | 0.000 | 0.000 | 0.000 | 0.000 | 0.998 | 0.002 | ||
| 7 spectra, AIENELLDR | 0.000 | 0.000 | 0.000 | 0.000 | 0.000 | 0.000 | 1.000 | 0.000 | ||
| 2 spectra, SDYMFQCSADGSK | 0.006 | 0.065 | 0.000 | 0.000 | 0.014 | 0.000 | 0.915 | 0.000 | ||
| 4 spectra, LFDLYK | 0.000 | 0.000 | 0.000 | 0.000 | 0.000 | 0.000 | 1.000 | 0.000 | ||
| 2 spectra, QLEELAQQAIDR | 0.000 | 0.125 | 0.000 | 0.000 | 0.000 | 0.000 | 0.875 | 0.000 | ||
| 2 spectra, ILSNNPSK | 0.000 | 0.056 | 0.000 | 0.000 | 0.000 | 0.000 | 0.944 | 0.000 | ||
| 4 spectra, TPAVHR | 0.000 | 0.000 | 0.000 | 0.000 | 0.000 | 0.000 | 0.969 | 0.031 | ||
| 3 spectra, VQQELSR | 0.000 | 0.019 | 0.000 | 0.000 | 0.000 | 0.000 | 0.981 | 0.000 | ||
| 1 spectrum, EGIAQTVFLGLNR | 0.158 | 0.072 | 0.000 | 0.000 | 0.000 | 0.000 | 0.770 | 0.000 | ||
| 6 spectra, GSLDQNR | 0.000 | 0.000 | 0.000 | 0.000 | 0.000 | 0.000 | 1.000 | 0.000 | ||
| 4 spectra, QGTTLVMNK | 0.030 | 0.018 | 0.000 | 0.000 | 0.000 | 0.000 | 0.952 | 0.000 | ||
| 2 spectra, TNEASK | 0.000 | 0.000 | 0.000 | 0.000 | 0.000 | 0.000 | 1.000 | 0.000 | ||
| 2 spectra, DEYTAR | 0.000 | 0.011 | 0.000 | 0.000 | 0.099 | 0.129 | 0.761 | 0.000 | ||
| 1 spectrum, EGGGNNFYGEEMVHALEQLK | 0.000 | 0.000 | 0.000 | 0.000 | 0.024 | 0.000 | 0.976 | 0.000 | ||
| 2 spectra, DGYMPSQYNAQNWEAR | 0.000 | 0.000 | 0.000 | 0.000 | 0.000 | 0.000 | 1.000 | 0.000 | ||
| 6 spectra, FEDVSER | 0.000 | 0.000 | 0.000 | 0.000 | 0.000 | 0.000 | 1.000 | 0.000 | ||
| 5 spectra, HVGHLLR | 0.000 | 0.000 | 0.000 | 0.000 | 0.004 | 0.000 | 0.996 | 0.000 | ||
| 11 spectra, ALAEGVLLR | 0.027 | 0.000 | 0.000 | 0.000 | 0.000 | 0.000 | 0.973 | 0.000 | ||
| 2 spectra, HVLNVLNK | 0.000 | 0.000 | 0.000 | 0.000 | 0.000 | 0.000 | 1.000 | 0.000 |
| Plot | Mito | Lyso or Perox | ER | Golgi | PM | Cytosol | Nucleus | ||||||
| Expt B |
10 peptides |
17 spectra |
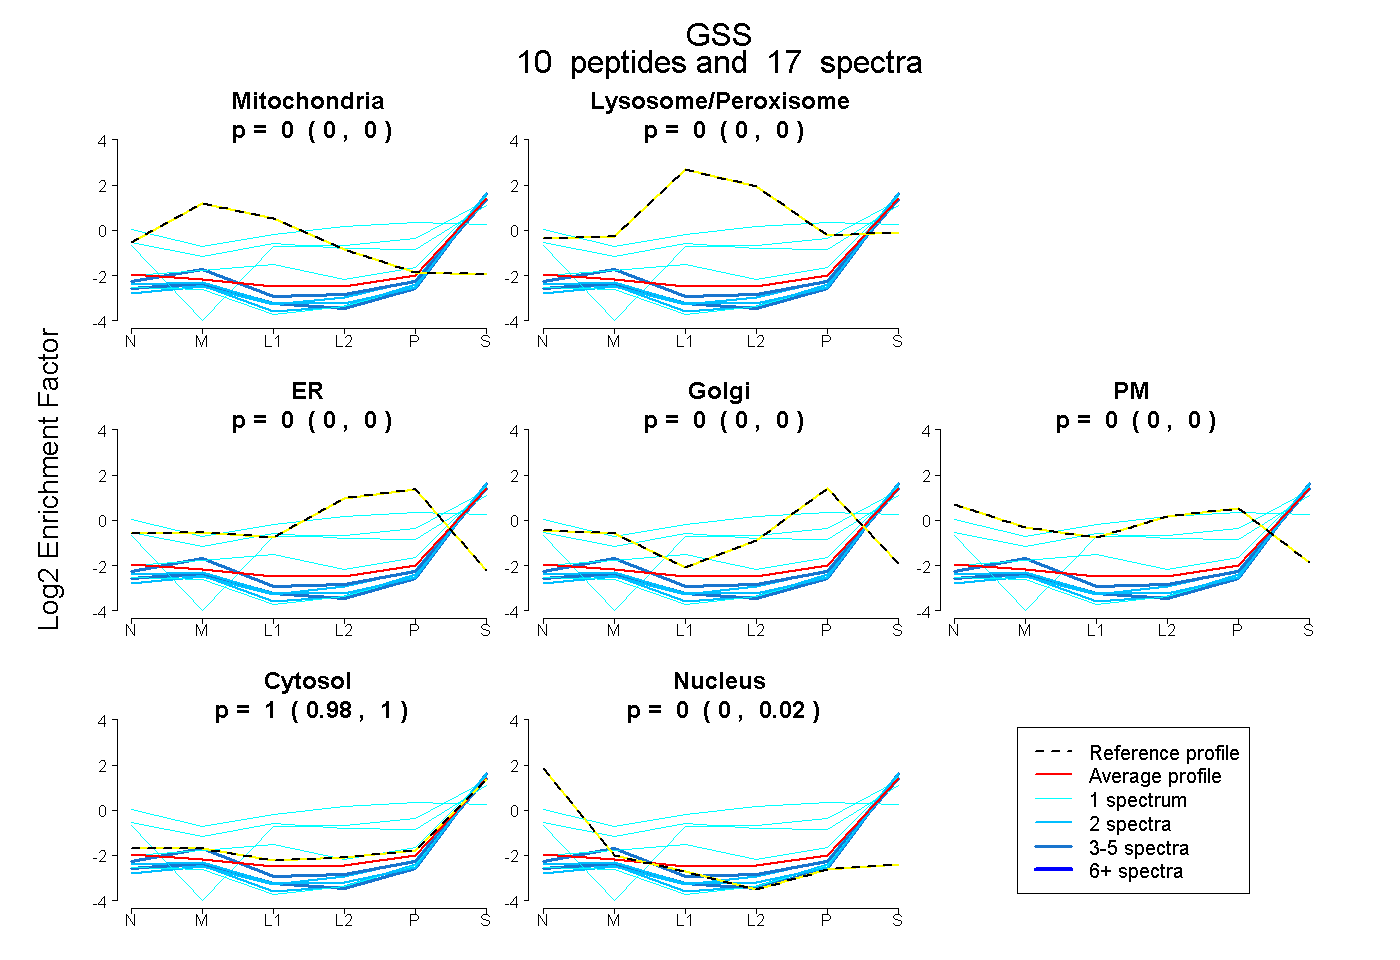 |
0.000 0.000 | 0.000 |
0.000 0.000 | 0.000 |
0.000 0.000 | 0.000 |
0.000 0.000 | 0.000 |
0.000 0.000 | 0.000 |
0.999 0.977 | 1.000 |
0.001 0.000 | 0.019 |
|||
| Plot | Lyso | Other | |||||||||||
| Expt C |
17 peptides |
80 spectra |
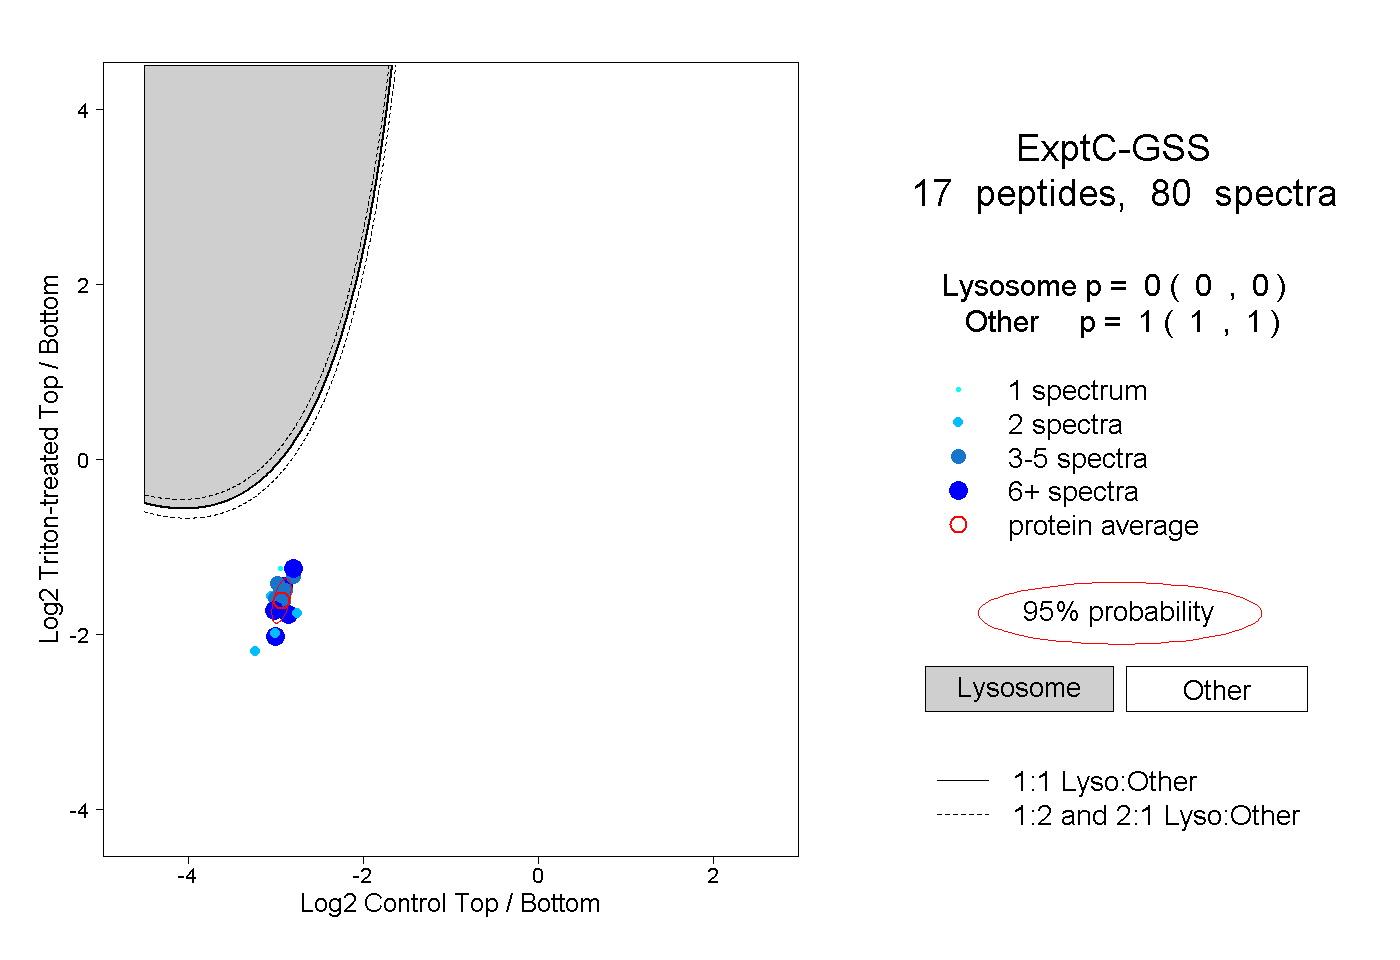 |
0.000 0.000 | 0.000 |
1.000 1.000 | 1.000 |
||||||||
| Plot | Lyso | Other | |||||||||||
| Expt D |
5 peptides |
7 spectra |
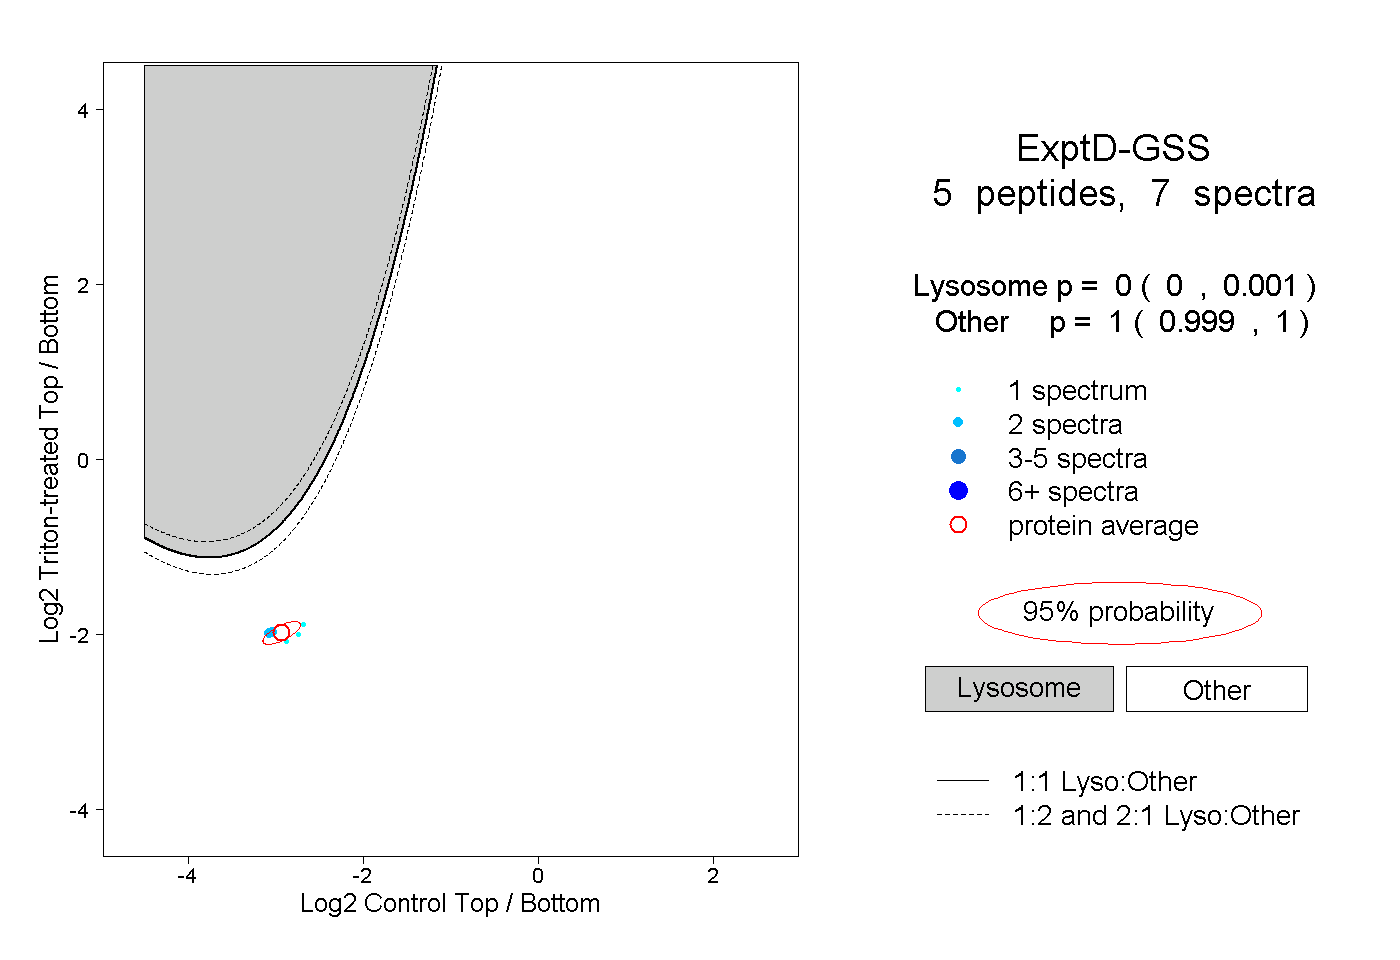 |
0.000 0.000 | 0.001 |
1.000 0.999 | 1.000 |