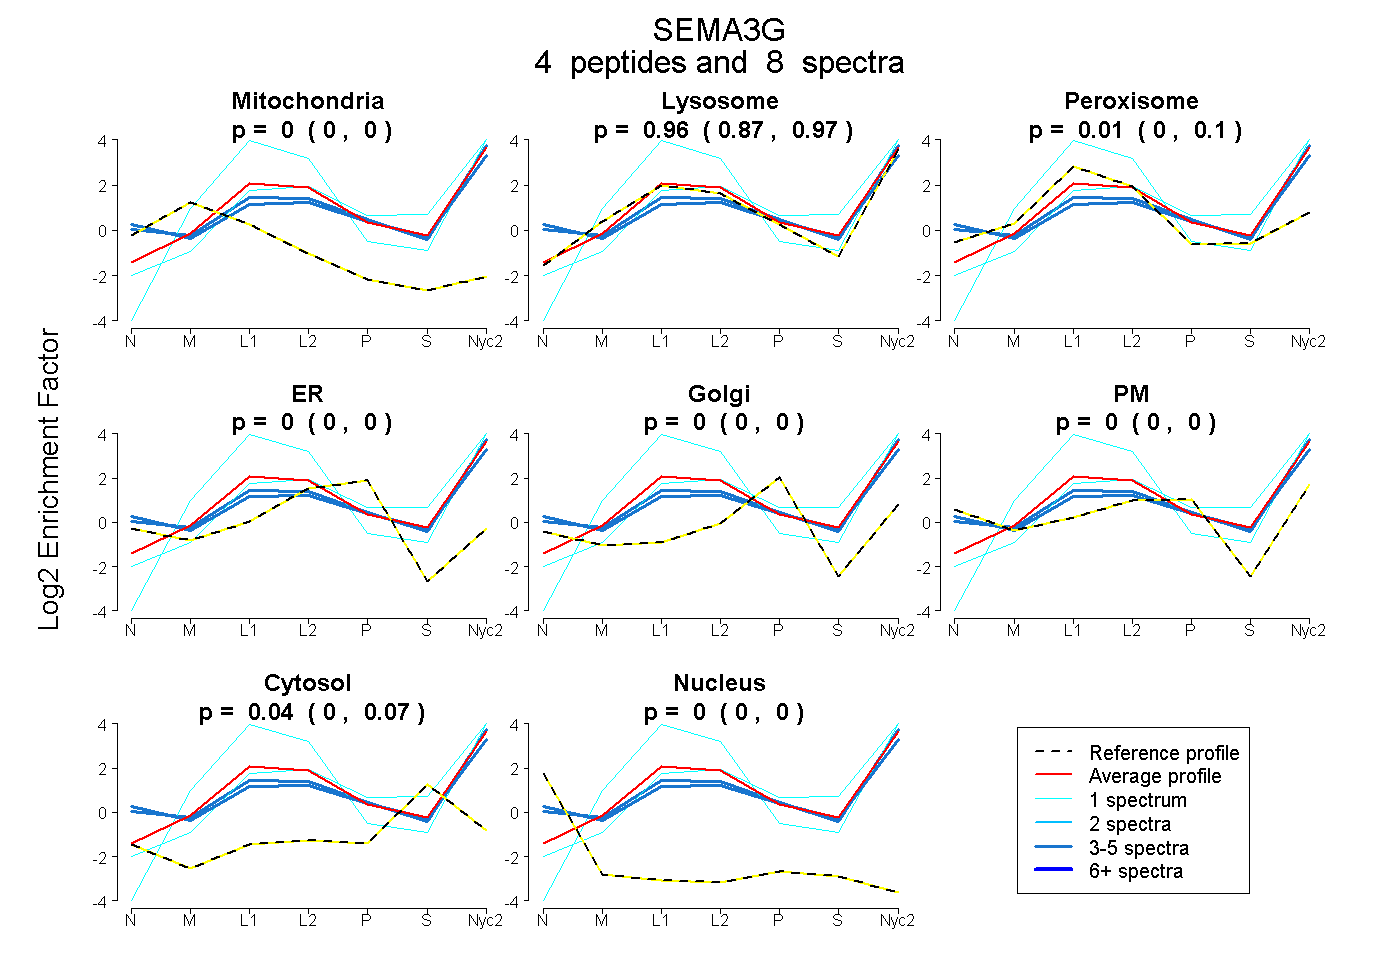
 4
4peptides
spectra
0.000 | 0.000
0.868 | 0.975
0.000 | 0.103
0.000 | 0.000
0.000 | 0.000
0.000 | 0.000
0.000 | 0.069
0.000 | 0.000
| Plot | Mito | Lyso | Perox | ER | Golgi | PM | Cytosol | Nucleus | |||||
| Expt A |
4 peptides |
8 spectra |
|
0.000 0.000 | 0.000 |
0.955 0.868 | 0.975 |
0.007 0.000 | 0.103 |
0.000 0.000 | 0.000 |
0.000 0.000 | 0.000 |
0.000 0.000 | 0.000 |
0.038 0.000 | 0.069 |
0.000 0.000 | 0.000 |
| 3 spectra, SGGPRPALR | 0.000 | 0.611 | 0.000 | 0.000 | 0.000 | 0.296 | 0.094 | 0.000 | ||
| 1 spectrum, LEEPSAWR | 0.000 | 1.000 | 0.000 | 0.000 | 0.000 | 0.000 | 0.000 | 0.000 | ||
| 1 spectrum, LFLGGR | 0.000 | 0.900 | 0.000 | 0.000 | 0.000 | 0.000 | 0.100 | 0.000 | ||
| 3 spectra, GHPLMFQPVRPR | 0.000 | 0.737 | 0.000 | 0.000 | 0.000 | 0.228 | 0.035 | 0.000 |
| Plot | Lyso | Other | |||||||||||
| Expt C |
9 peptides |
19 spectra |
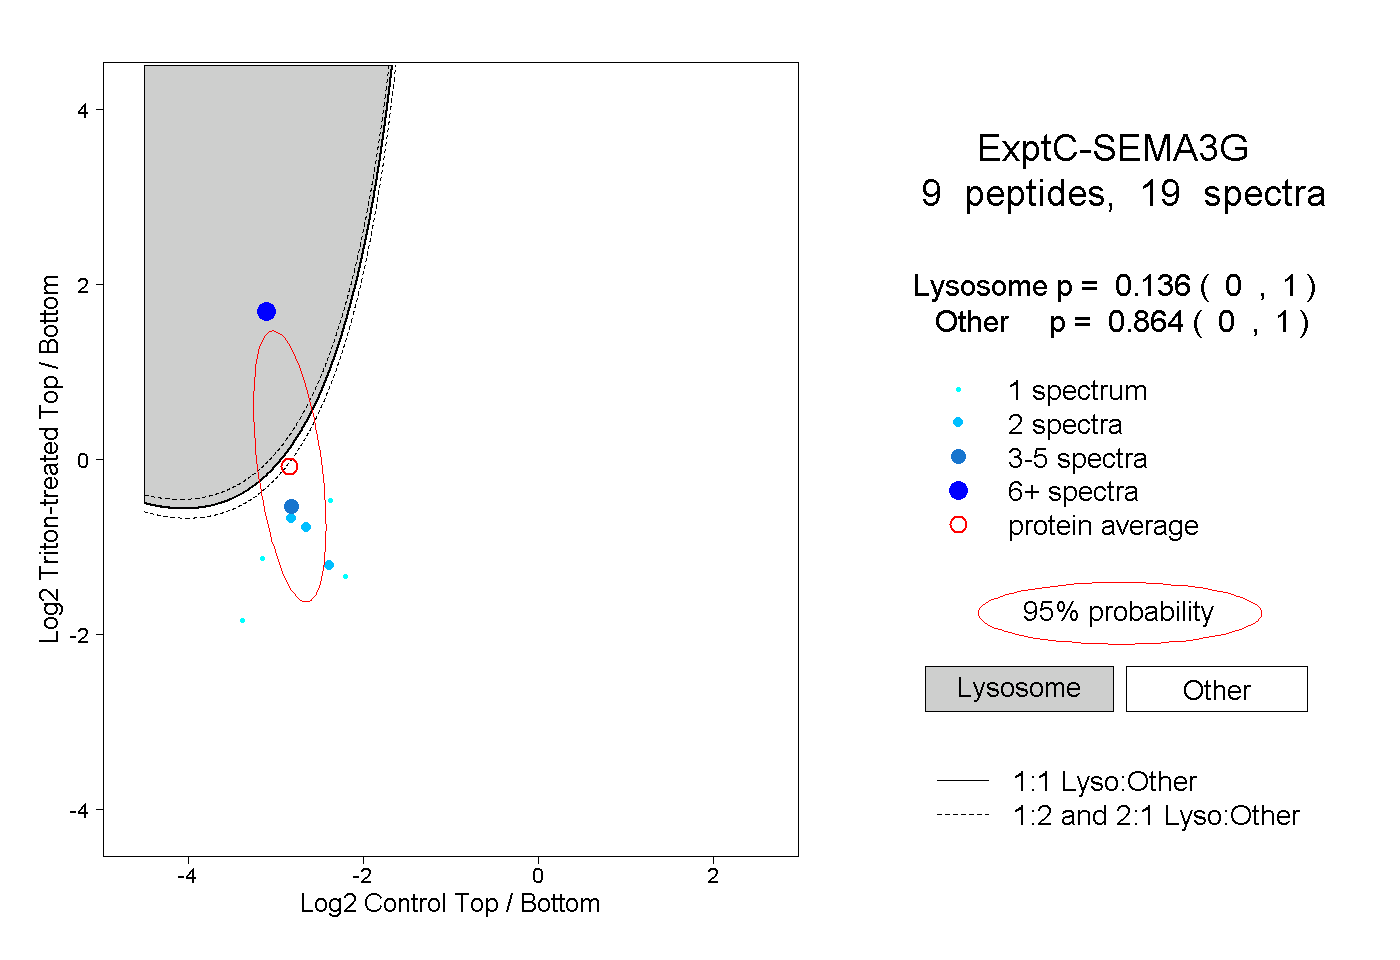 |
0.136 0.000 | 1.000 |
0.864 0.000 | 1.000 |
||||||||
| Plot | Lyso | Other | |||||||||||
| Expt D |
1 peptide |
1 spectrum |
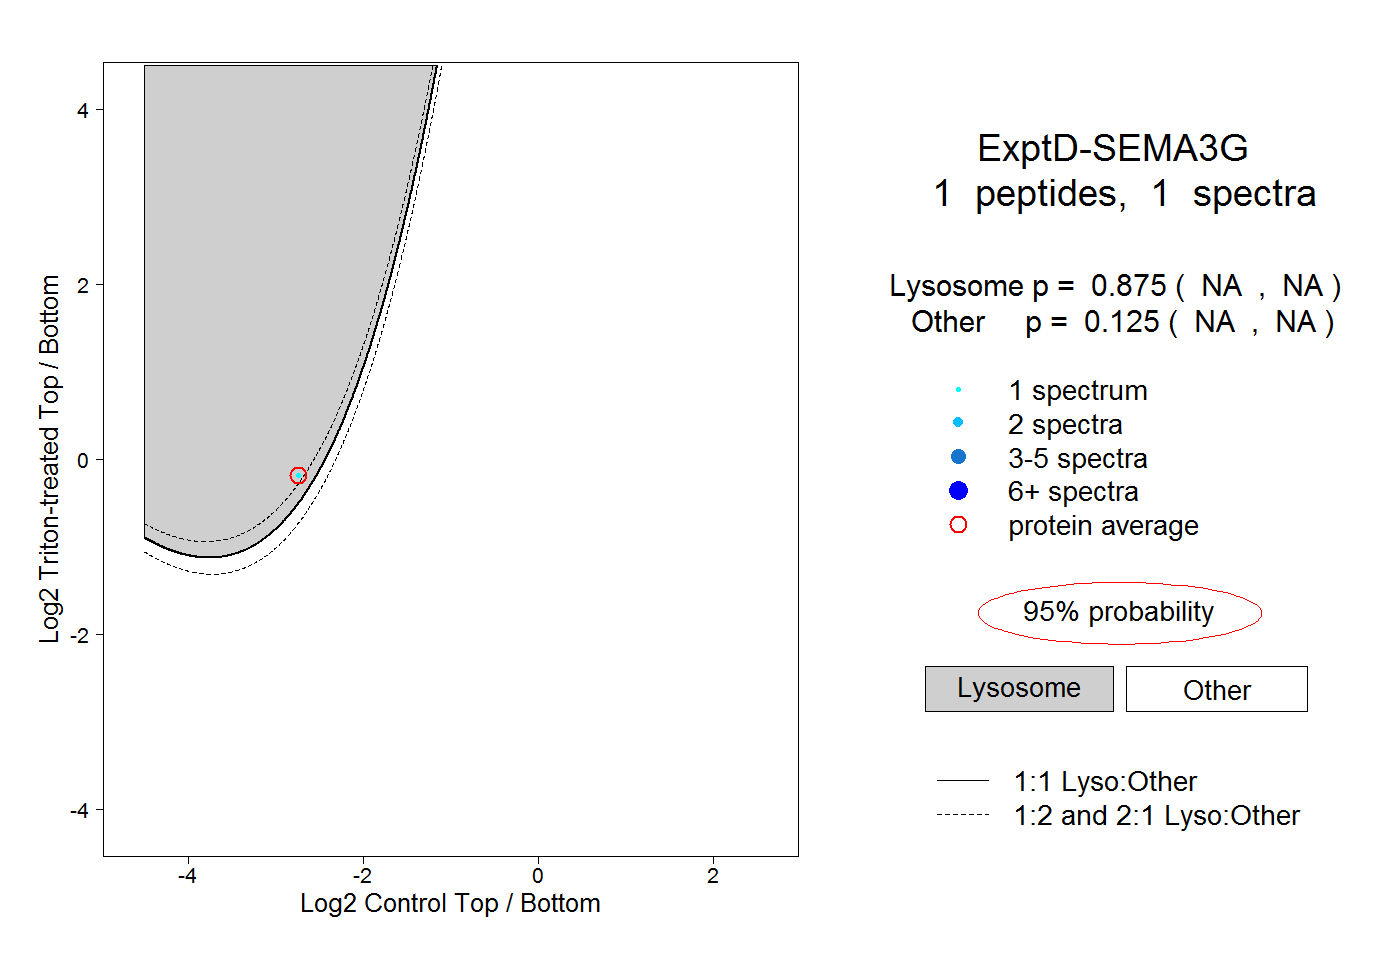 |
0.875 NA | NA |
0.125 NA | NA |