 3
3peptides
spectra
0.000 | 0.086
0.000 | 0.081
0.000 | 0.235
0.031 | 0.643
0.000 | 0.302
0.000 | 0.303
0.000 | 0.338
0.082 | 0.362
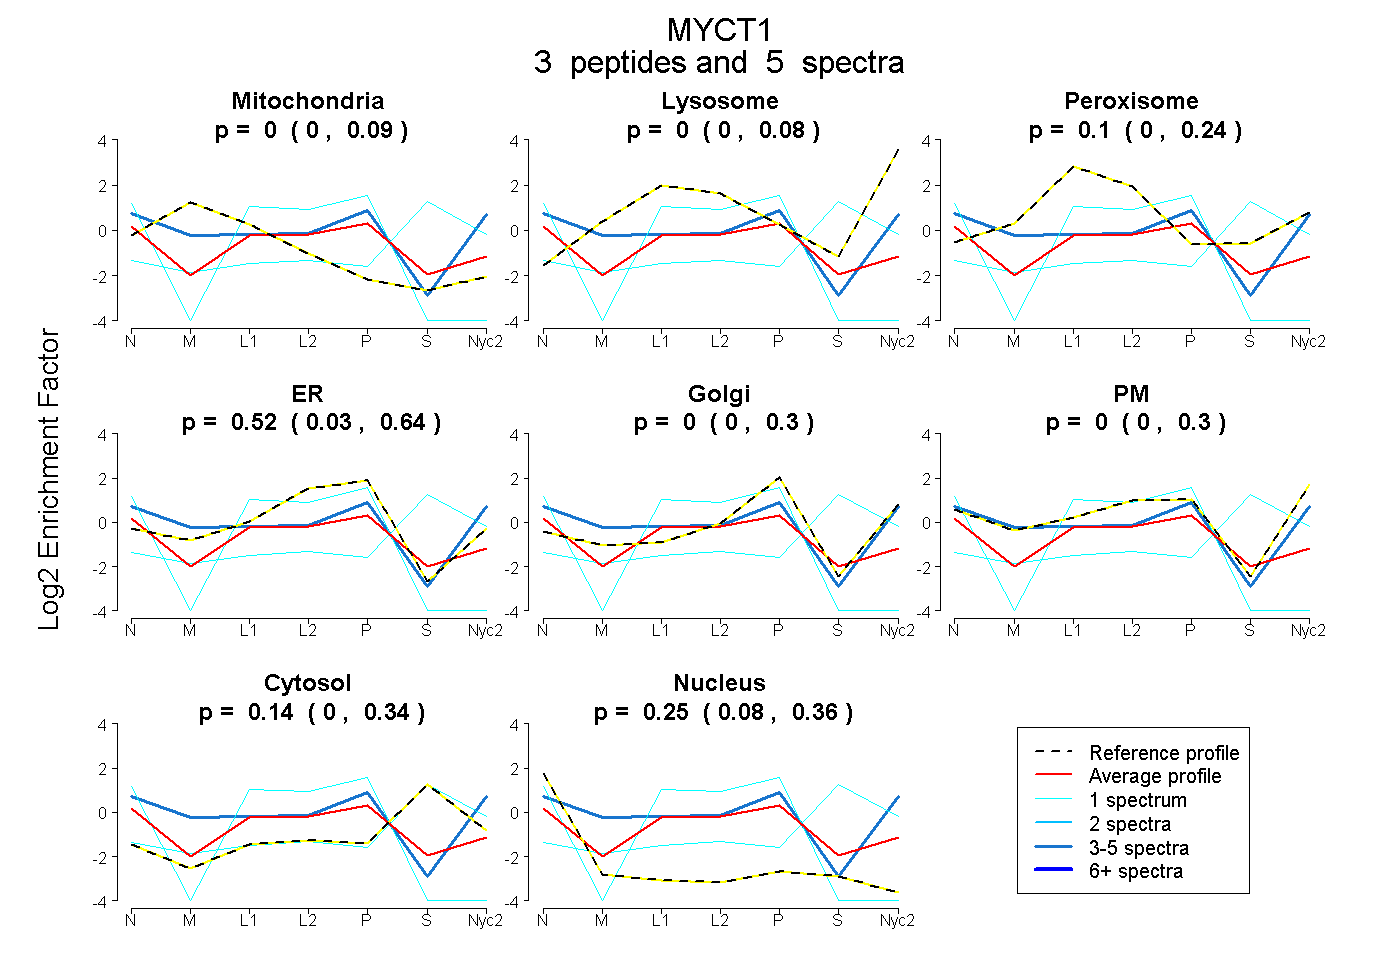
| Plot | Mito | Lyso | Perox | ER | Golgi | PM | Cytosol | Nucleus | |||||
| Expt A |
3 peptides |
5 spectra |
|
0.000 0.000 | 0.086 |
0.000 0.000 | 0.081 |
0.095 0.000 | 0.235 |
0.517 0.031 | 0.643 |
0.000 0.000 | 0.302 |
0.000 0.000 | 0.303 |
0.136 0.000 | 0.338 |
0.252 0.082 | 0.362 |
| 1 spectrum, SNLSLASLTFQR | 0.000 | 0.000 | 0.000 | 0.674 | 0.000 | 0.000 | 0.000 | 0.326 | ||
| 3 spectra, ASAPISQWSPTR | 0.113 | 0.000 | 0.000 | 0.000 | 0.204 | 0.606 | 0.000 | 0.077 | ||
| 1 spectrum, QASLELANSFPR | 0.015 | 0.070 | 0.000 | 0.000 | 0.000 | 0.000 | 0.915 | 0.000 |