ABCC10
[ENSRNOP00000025598]
Main page
| | | Plot |
Mito |
Lyso |
|
Perox |
ER |
Golgi |
PM |
Cytosol |
Nucleus |
|
| Expt A |
 18
18
peptides |
32
spectra |
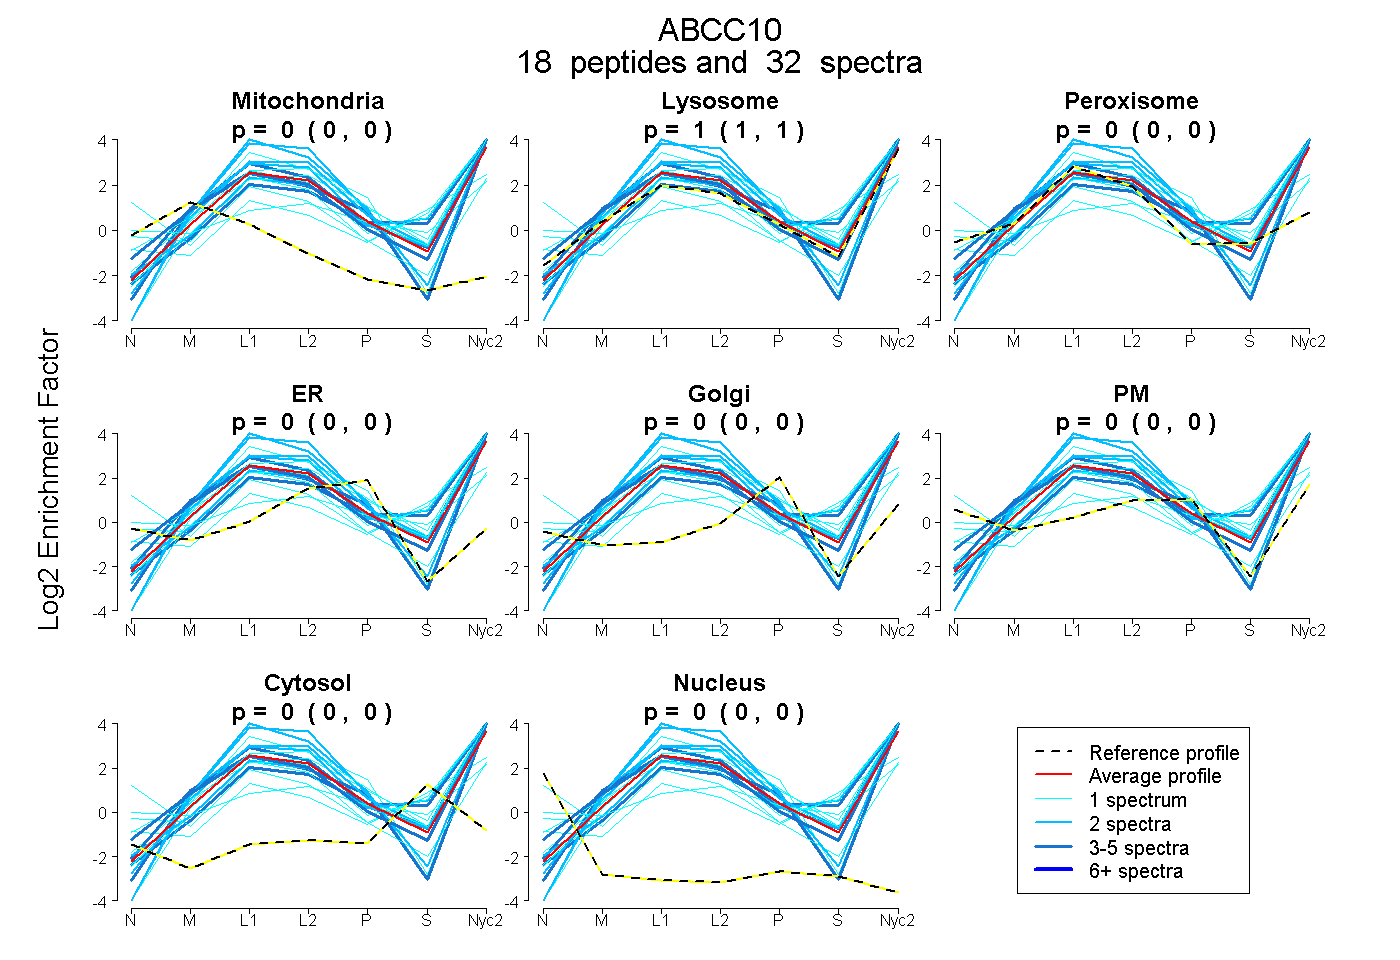 |
0.000
0.000 | 0.000 |
1.000
1.000 | 1.000 |
|
0.000
0.000 | 0.000 |
0.000
0.000 | 0.000 |
0.000
0.000 | 0.000 |
0.000
0.000 | 0.000 |
0.000
0.000 | 0.000 |
0.000
0.000 | 0.000 |
|
| | | Plot |
Mito |
|
Lyso or Perox |
|
ER |
Golgi |
PM |
Cytosol |
Nucleus |
|
| Expt B |
6
peptides |
8
spectra |
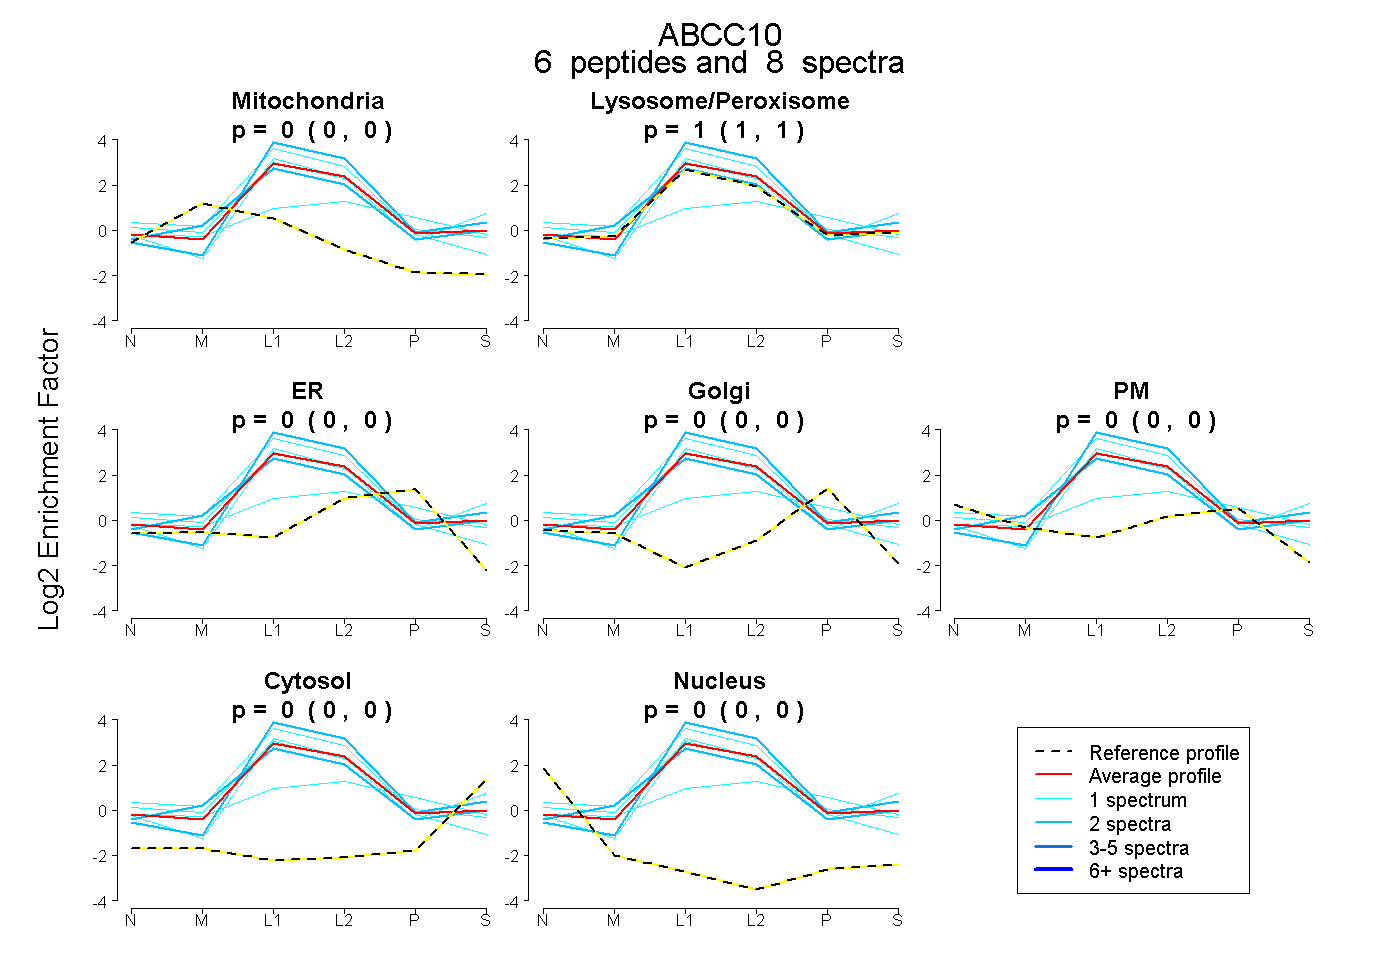 |
0.000
0.000 | 0.000 |
|
1.000
1.000 | 1.000 |
|
0.000
0.000 | 0.000 |
0.000
0.000 | 0.000 |
0.000
0.000 | 0.000 |
0.000
0.000 | 0.000 |
0.000
0.000 | 0.000 |
|
| 1 spectrum, VVELDSPSALR |
0.000 |
|
0.686 |
|
0.000 |
0.310 |
0.000 |
0.004 |
0.000 |
|
| 2 spectra, TVLTIAHR |
0.031 |
|
0.969 |
|
0.000 |
0.000 |
0.000 |
0.000 |
0.000 |
|
| 1 spectrum, IGIVGR |
0.000 |
|
1.000 |
|
0.000 |
0.000 |
0.000 |
0.000 |
0.000 |
|
| 1 spectrum, FEEENQR |
0.000 |
|
1.000 |
|
0.000 |
0.000 |
0.000 |
0.000 |
0.000 |
|
| 1 spectrum, ENLDPQGLHEDR |
0.000 |
|
1.000 |
|
0.000 |
0.000 |
0.000 |
0.000 |
0.000 |
|
| 2 spectra, VLVLQAGR |
0.000 |
|
1.000 |
|
0.000 |
0.000 |
0.000 |
0.000 |
0.000 |
|
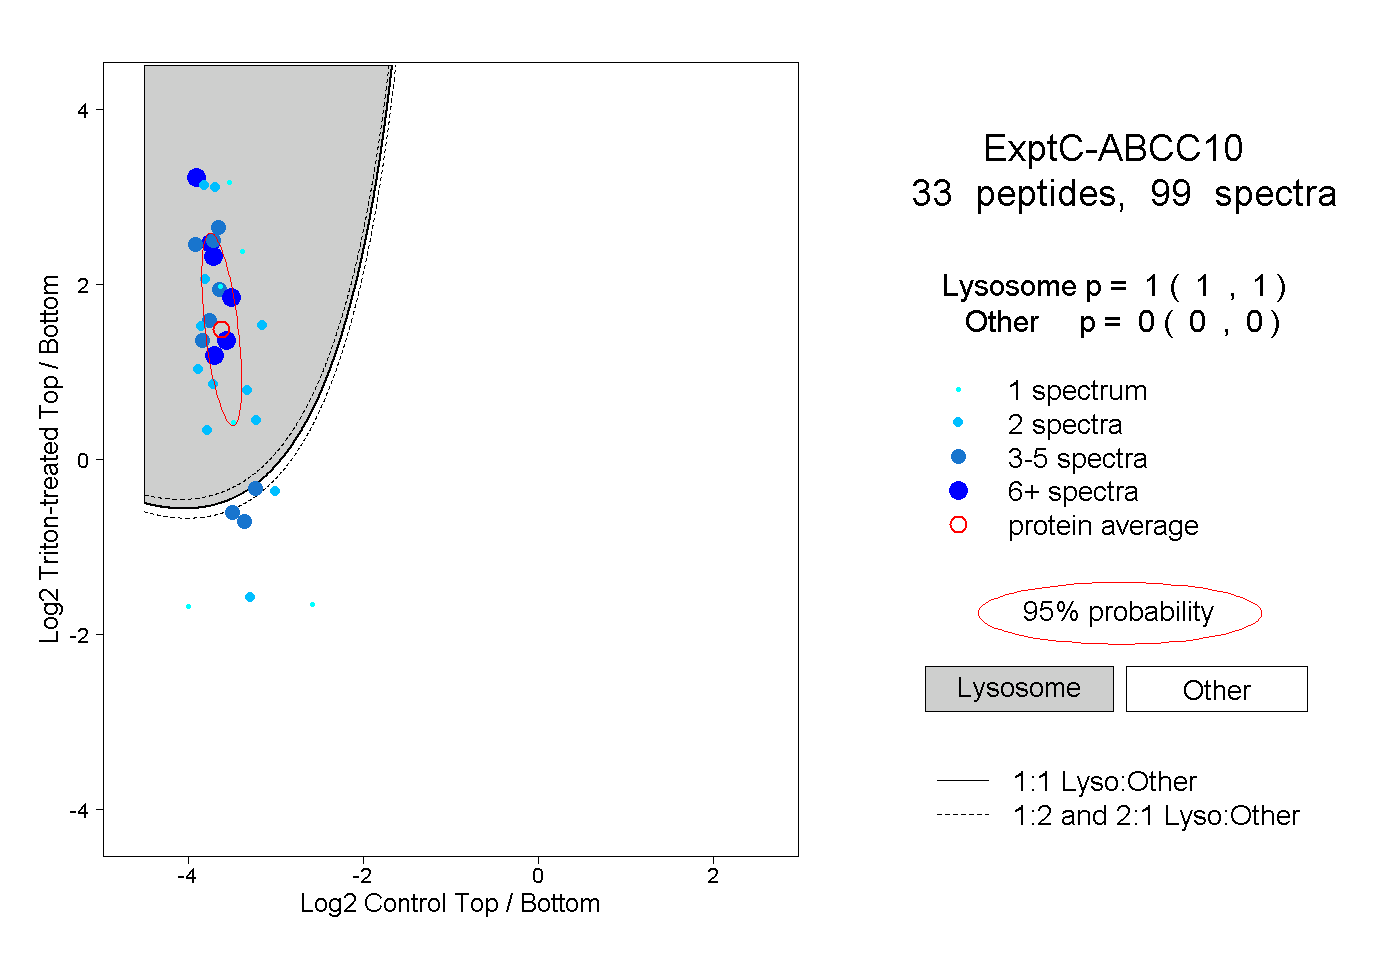
| | | Plot |
|
Lyso |
|
|
|
|
|
|
|
Other |
| Expt C |
33
peptides |
99
spectra |
 |
|
1.000
1.000 | 1.000 |
|
|
|
|
|
|
|
0.000
0.000 | 0.000 |
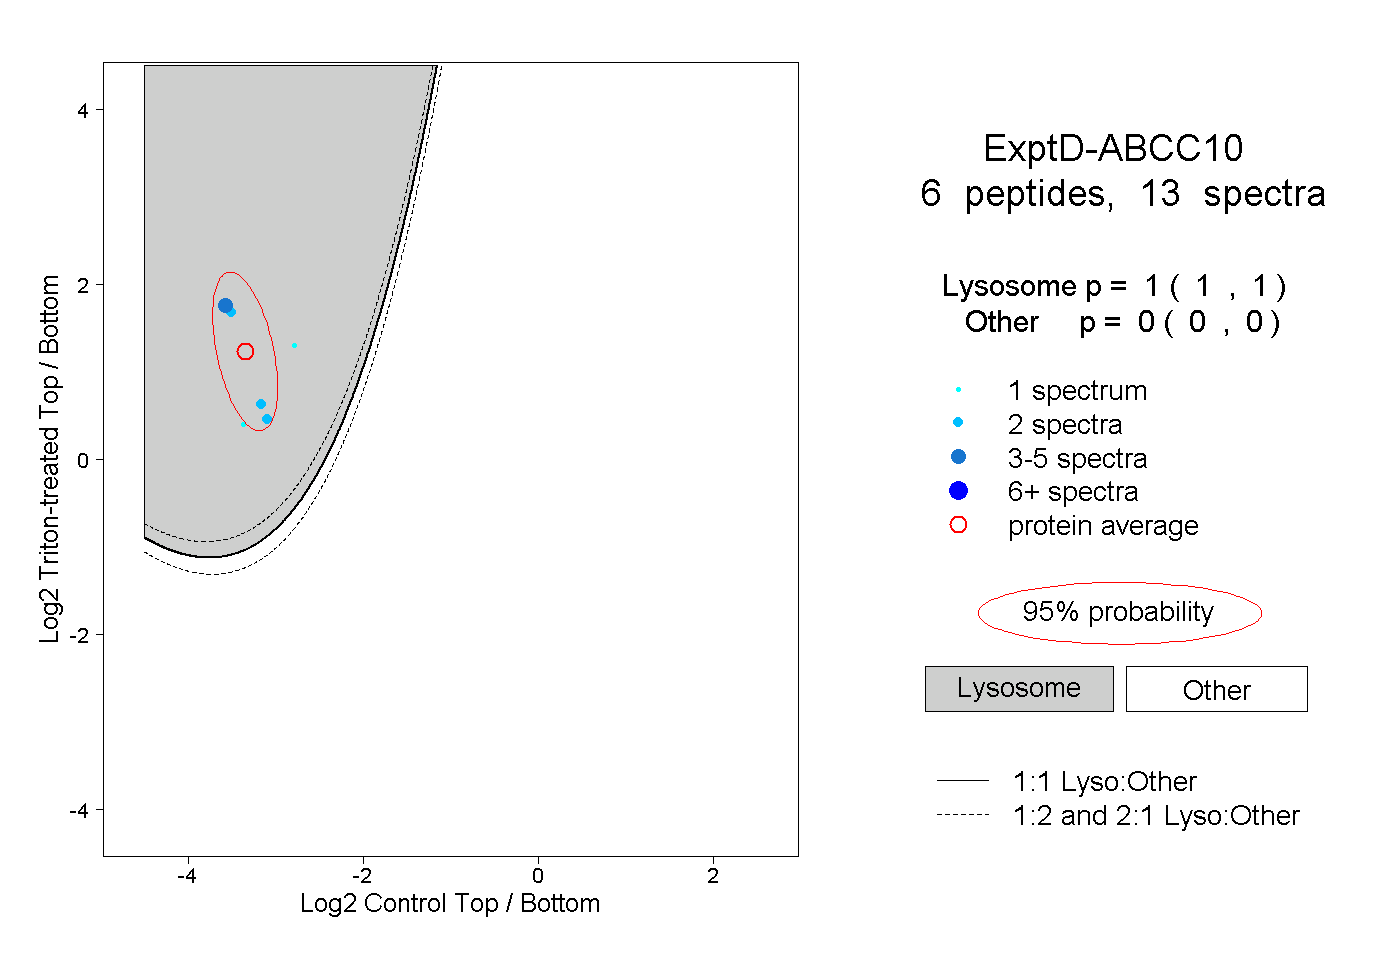
| | | Plot |
|
Lyso |
|
|
|
|
|
|
|
Other |
| Expt D |
6
peptides |
13
spectra |
 |
|
1.000
1.000 | 1.000 |
|
|
|
|
|
|
|
0.000
0.000 | 0.000 |