 5
5peptides
spectra
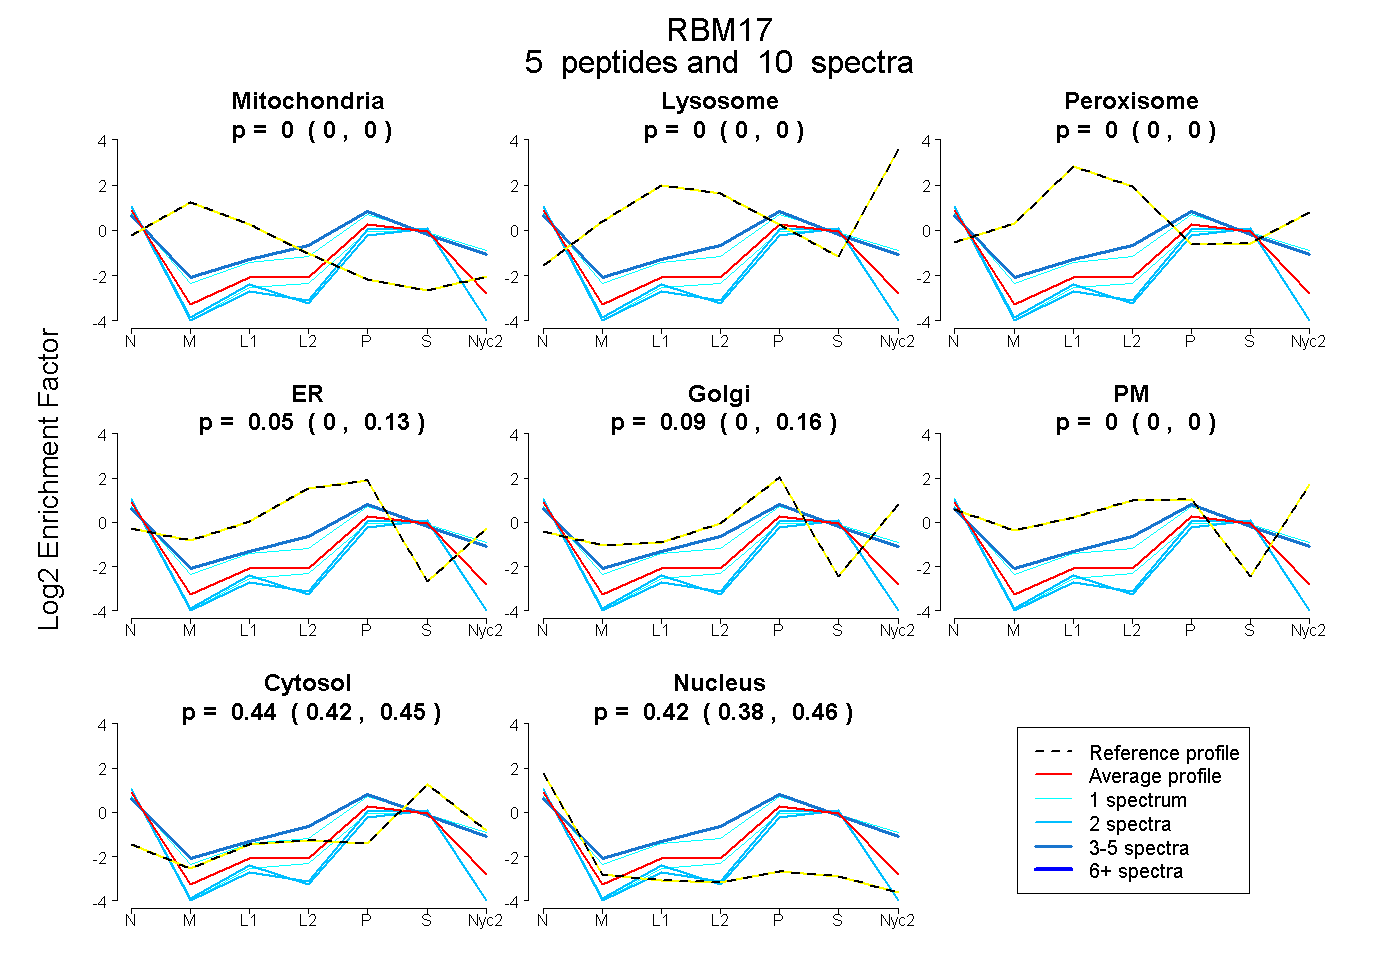
0.000 | 0.000
0.000 | 0.000
0.000 | 0.000
0.000 | 0.133
0.000 | 0.164
0.000 | 0.000
0.422 | 0.453
0.382 | 0.455
1peptide
spectrum

NA | NA
NA | NA
| Plot | Mito | Lyso | Perox | ER | Golgi | PM | Cytosol | Nucleus | |||||
| Expt A |
5 peptides |
10 spectra |
|
0.000 0.000 | 0.000 |
0.000 0.000 | 0.000 |
0.000 0.000 | 0.000 |
0.047 0.000 | 0.133 |
0.090 0.000 | 0.164 |
0.000 0.000 | 0.000 |
0.441 0.422 | 0.453 |
0.422 0.382 | 0.455 |
||
| Plot | Lyso | Other | |||||||||||
| Expt C |
1 peptide |
1 spectrum |
|
0.000 NA | NA |
1.000 NA | NA |