 4
4peptides
spectra
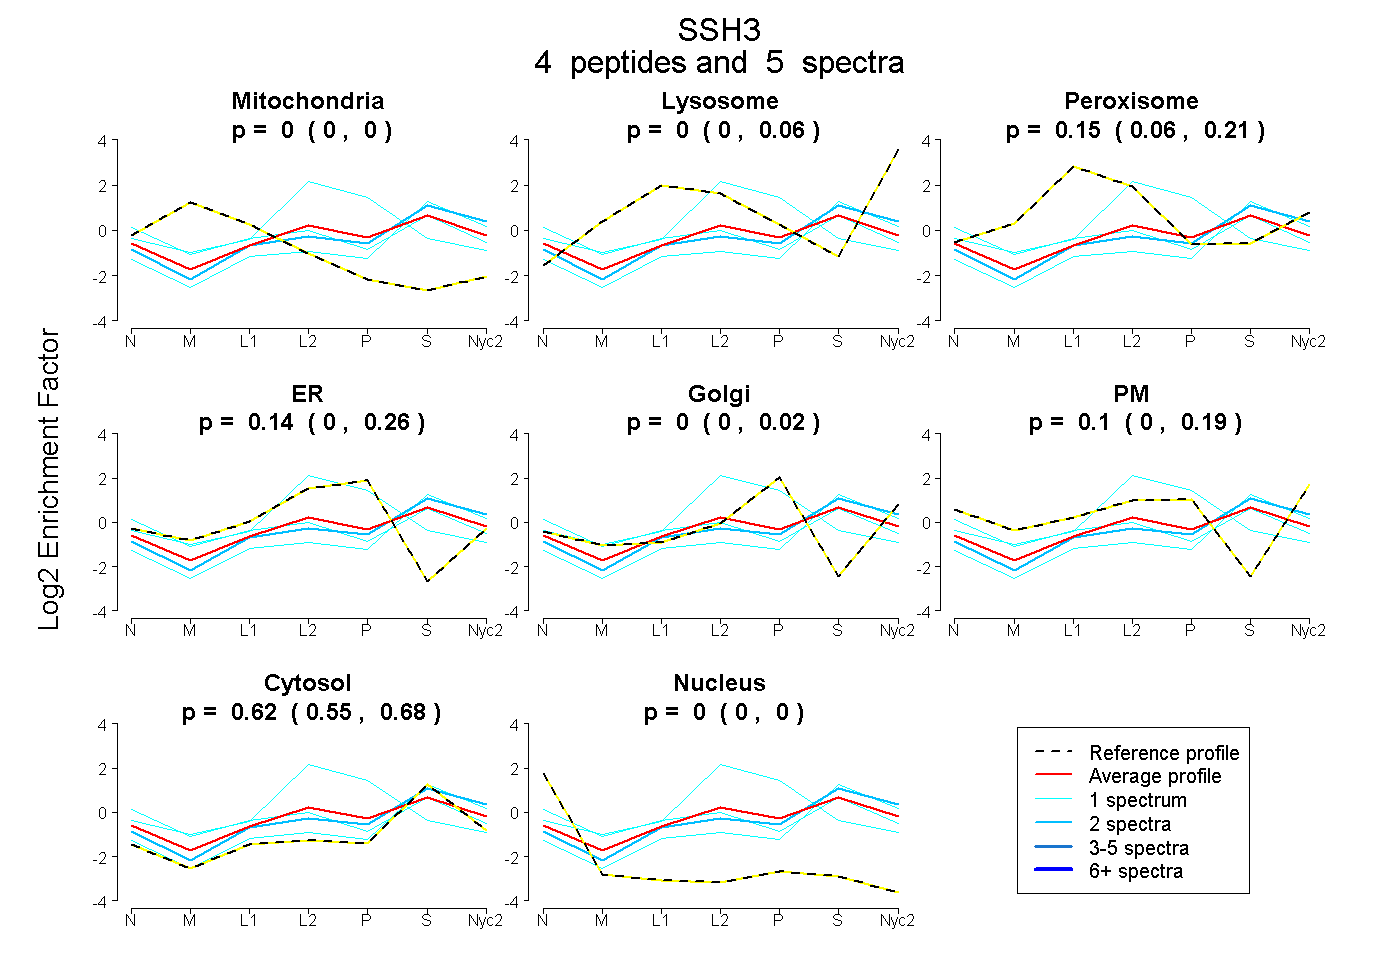
0.000 | 0.000
0.000 | 0.057
0.059 | 0.206
0.000 | 0.259
0.000 | 0.024
0.000 | 0.193
0.550 | 0.677
0.000 | 0.000
1peptide
spectra
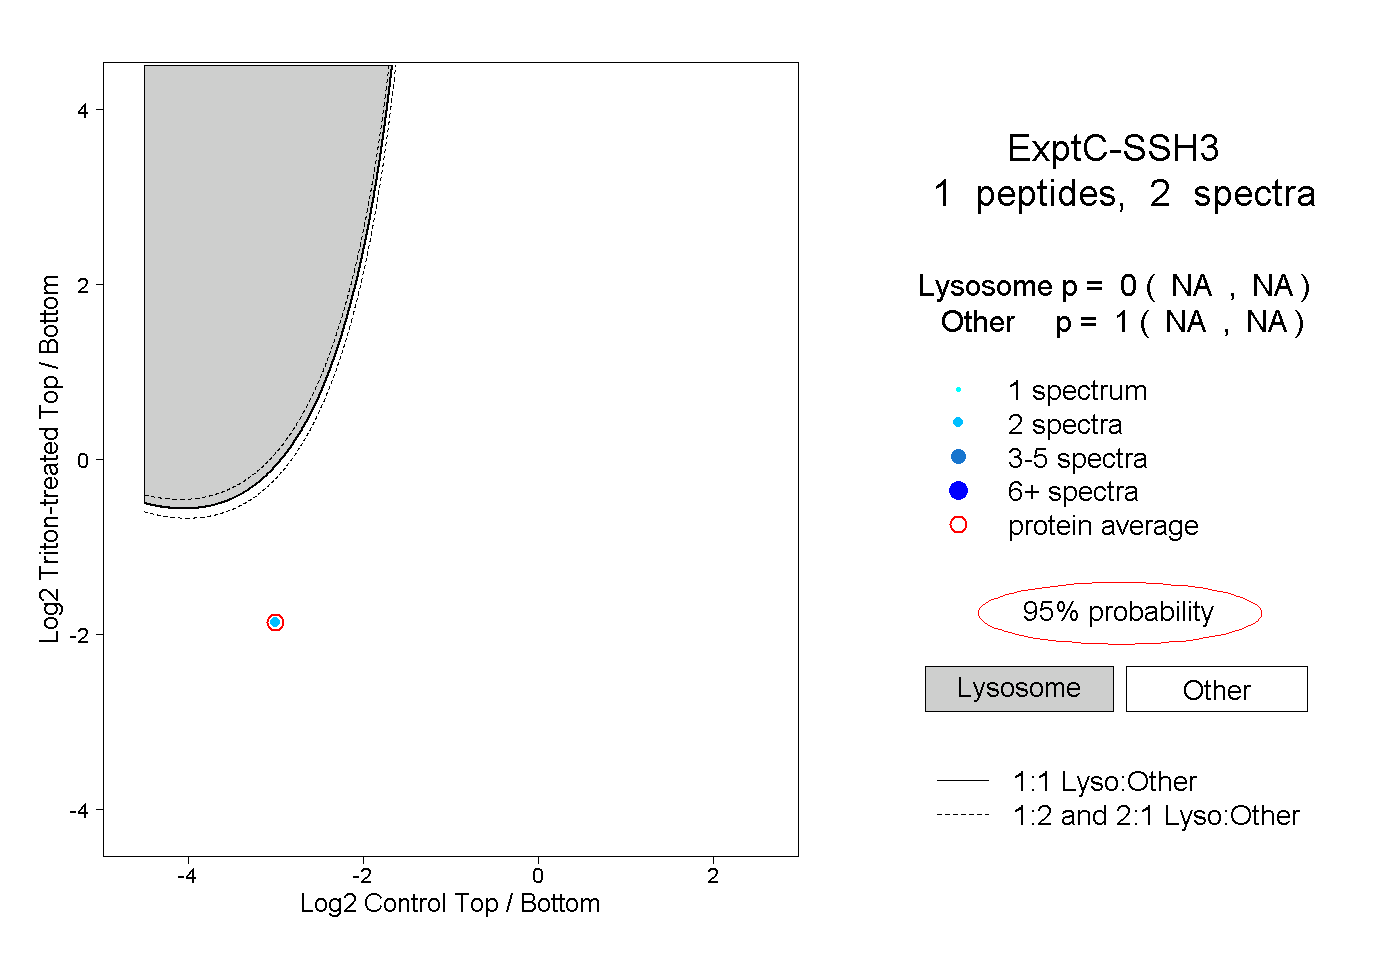
NA | NA
NA | NA
| Plot | Mito | Lyso | Perox | ER | Golgi | PM | Cytosol | Nucleus | |||||
| Expt A |
4 peptides |
5 spectra |
|
0.000 0.000 | 0.000 |
0.000 0.000 | 0.057 |
0.147 0.059 | 0.206 |
0.136 0.000 | 0.259 |
0.000 0.000 | 0.024 |
0.095 0.000 | 0.193 |
0.621 0.550 | 0.677 |
0.000 0.000 | 0.000 |
||
| Plot | Lyso | Other | |||||||||||
| Expt C |
1 peptide |
2 spectra |
|
0.000 NA | NA |
1.000 NA | NA |