CAR14
[ENSRNOP00000025523]
Main page
| | | Plot |
Mito |
Lyso |
|
Perox |
ER |
Golgi |
PM |
Cytosol |
Nucleus |
|
| Expt A |
 7
7
peptides |
31
spectra |
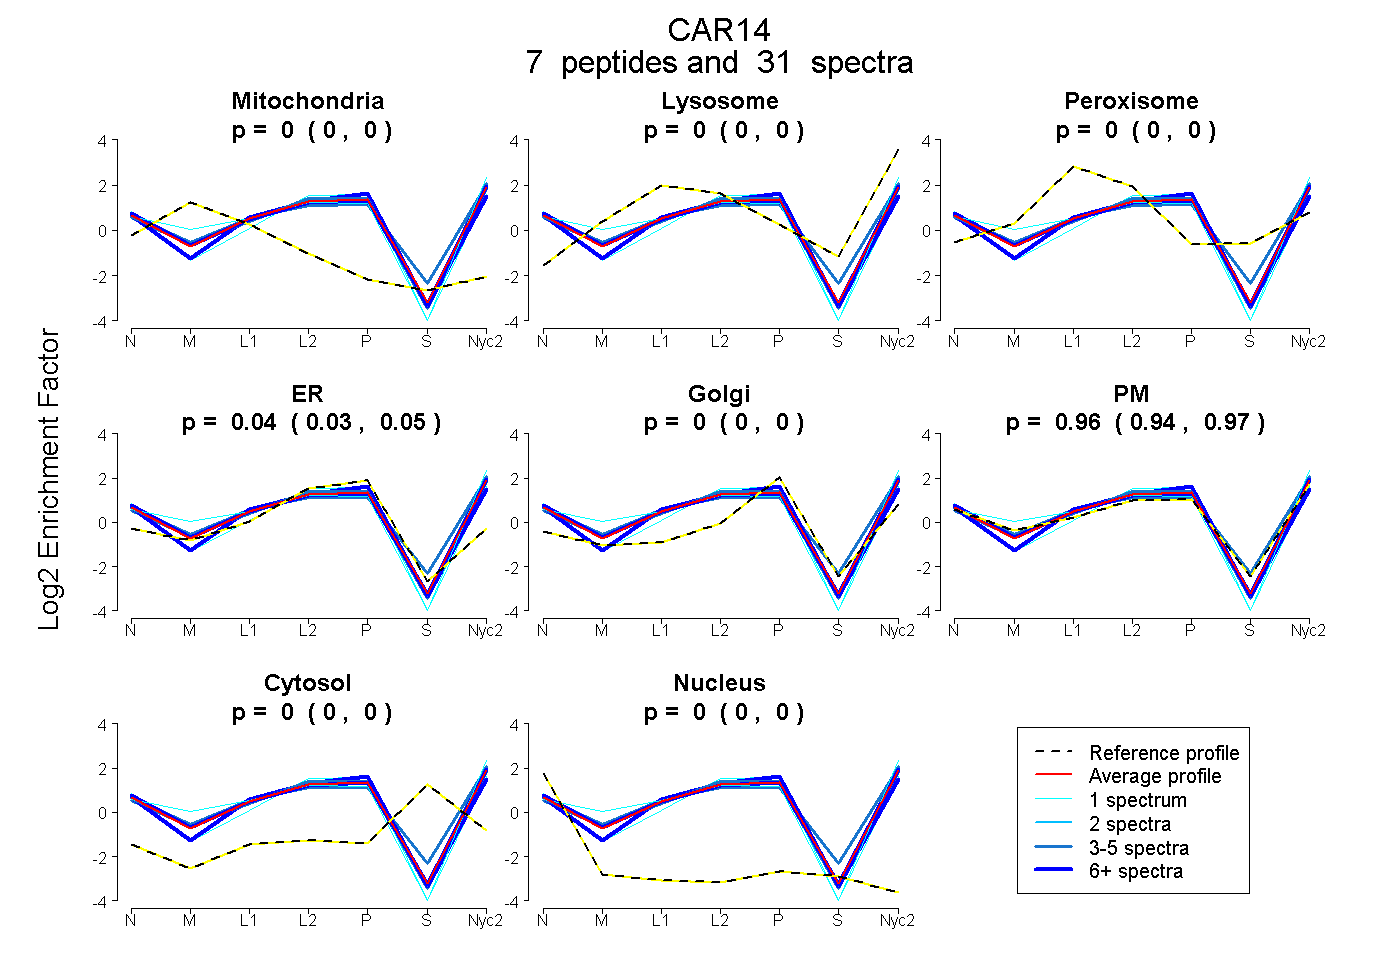 |
0.000
0.000 | 0.000 |
0.000
0.000 | 0.000 |
|
0.000
0.000 | 0.000 |
0.042
0.028 | 0.053 |
0.000
0.000 | 0.000 |
0.958
0.944 | 0.969 |
0.000
0.000 | 0.000 |
0.000
0.000 | 0.000 |
|
| | | Plot |
Mito |
|
Lyso or Perox |
|
ER |
Golgi |
PM |
Cytosol |
Nucleus |
|
| Expt B |
4
peptides |
9
spectra |
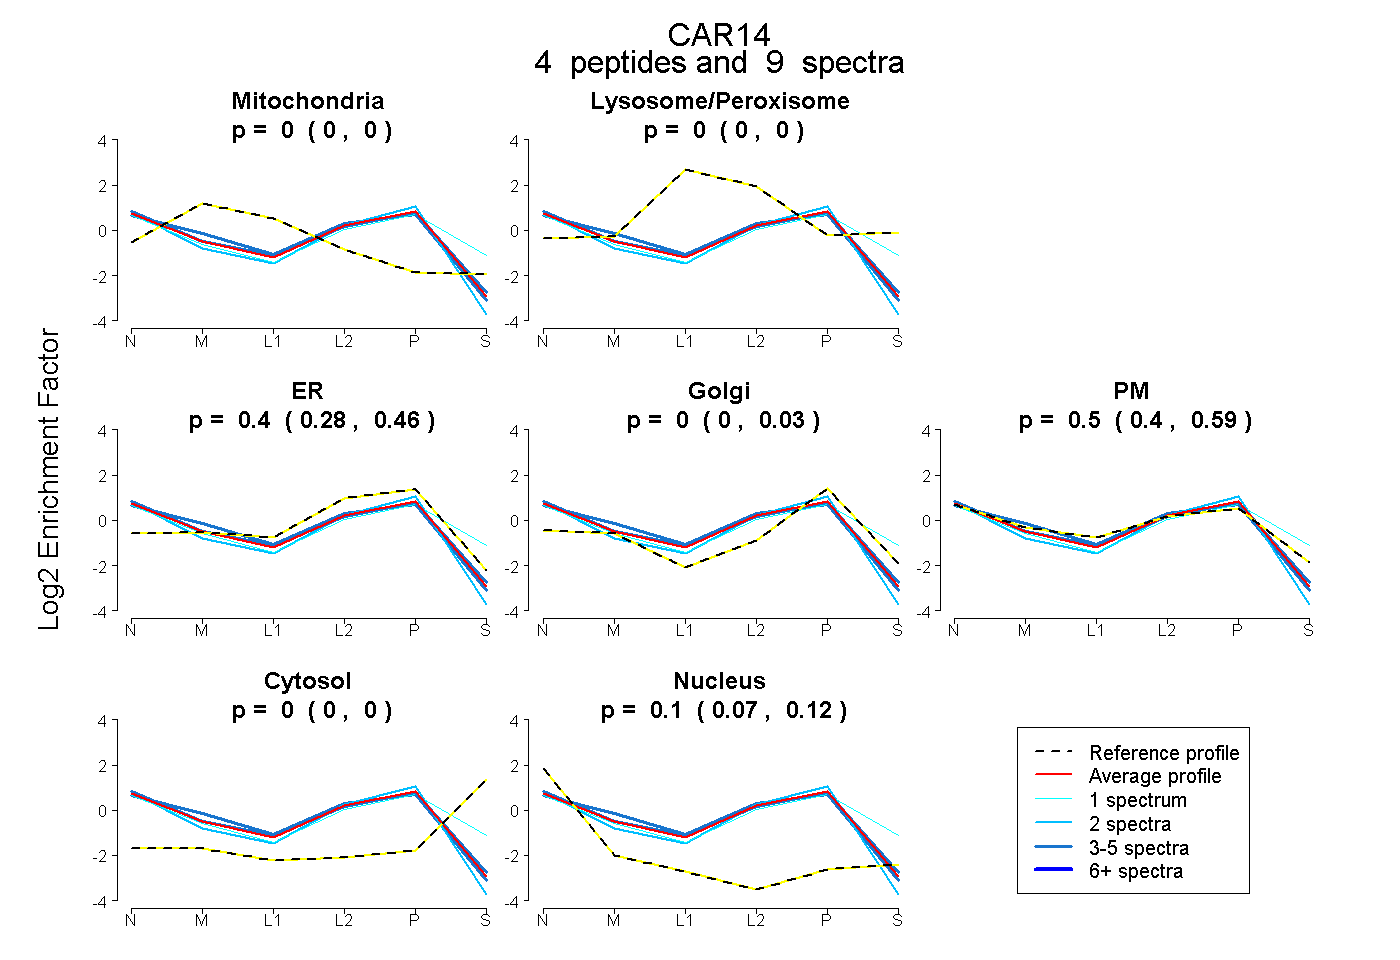 |
0.000
0.000 | 0.000 |
|
0.000
0.000 | 0.000 |
|
0.400
0.284 | 0.463 |
0.000
0.000 | 0.034 |
0.498
0.399 | 0.588 |
0.000
0.000 | 0.000 |
0.102
0.066 | 0.122 |
|
| 3 spectra, VPQPLNQR |
0.000 |
|
0.000 |
|
0.290 |
0.000 |
0.628 |
0.000 |
0.082 |
|
| 2 spectra, SVVFTSAR |
0.000 |
|
0.000 |
|
0.749 |
0.000 |
0.053 |
0.000 |
0.198 |
|
| 3 spectra, ELLPQQLEQFFR |
0.000 |
|
0.000 |
|
0.368 |
0.000 |
0.563 |
0.000 |
0.070 |
|
| 1 spectrum, TSVPPFNVR |
0.000 |
|
0.000 |
|
0.000 |
0.143 |
0.760 |
0.097 |
0.000 |
|
| | | Plot |
|
Lyso |
|
|
|
|
|
|
|
Other |
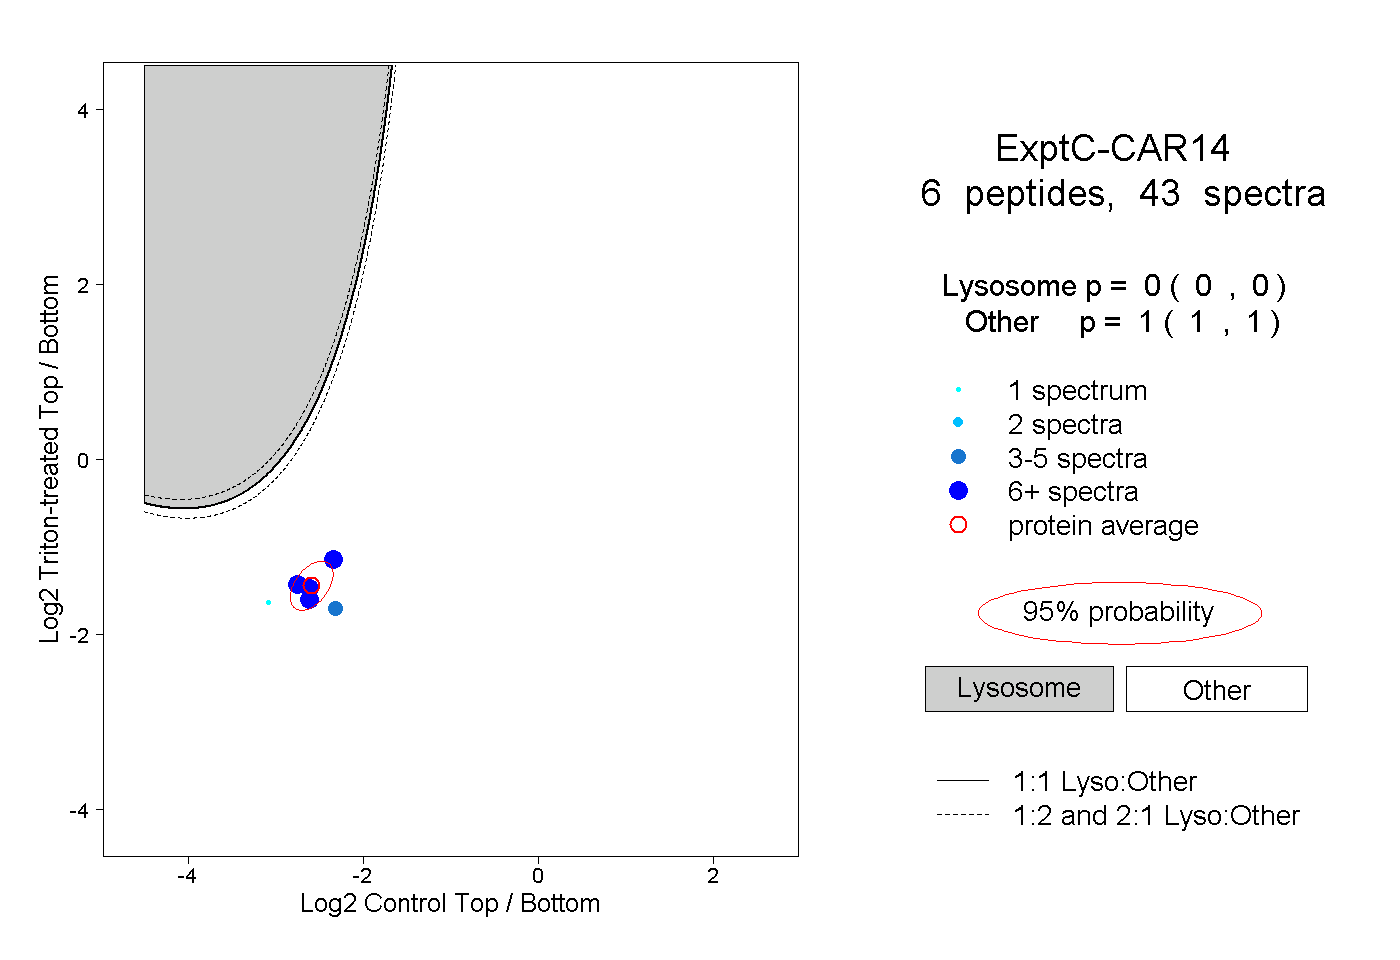
| Expt C |
6
peptides |
43
spectra |
 |
|
0.000
0.000 | 0.000 |
|
|
|
|
|
|
|
1.000
1.000 | 1.000 |
| | | Plot |
|
Lyso |
|
|
|
|
|
|
|
Other |
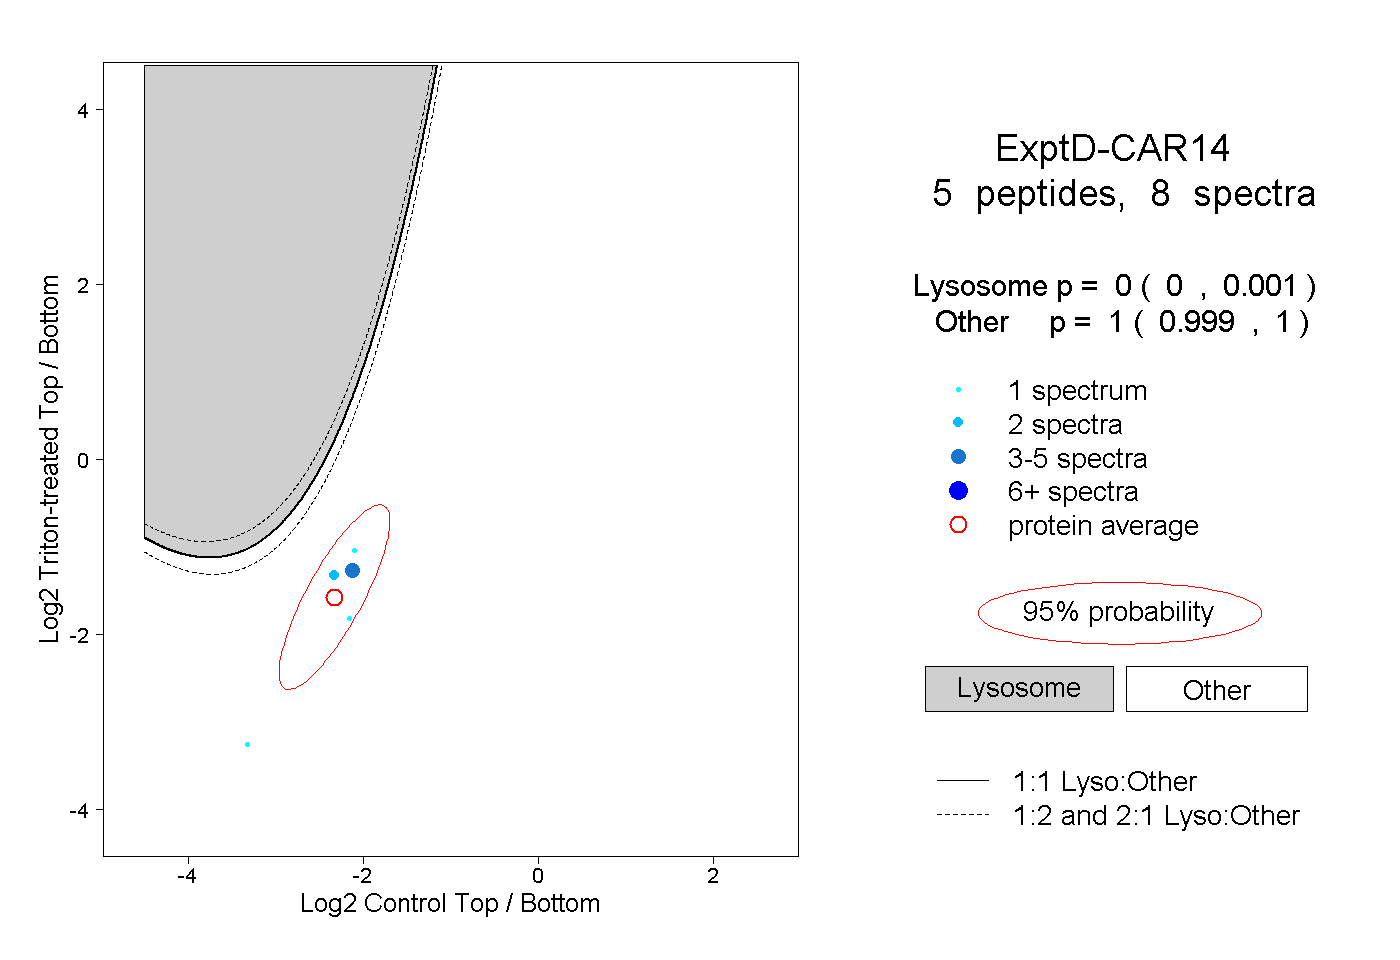
| Expt D |
5
peptides |
8
spectra |
 |
|
0.000
0.000 | 0.001 |
|
|
|
|
|
|
|
1.000
0.999 | 1.000 |