 7
7peptides
spectra
0.000 | 0.000
0.000 | 0.000
0.000 | 0.000
0.028 | 0.053
0.000 | 0.000
0.944 | 0.969
0.000 | 0.000
0.000 | 0.000
| Plot | Mito | Lyso | Perox | ER | Golgi | PM | Cytosol | Nucleus | |||||
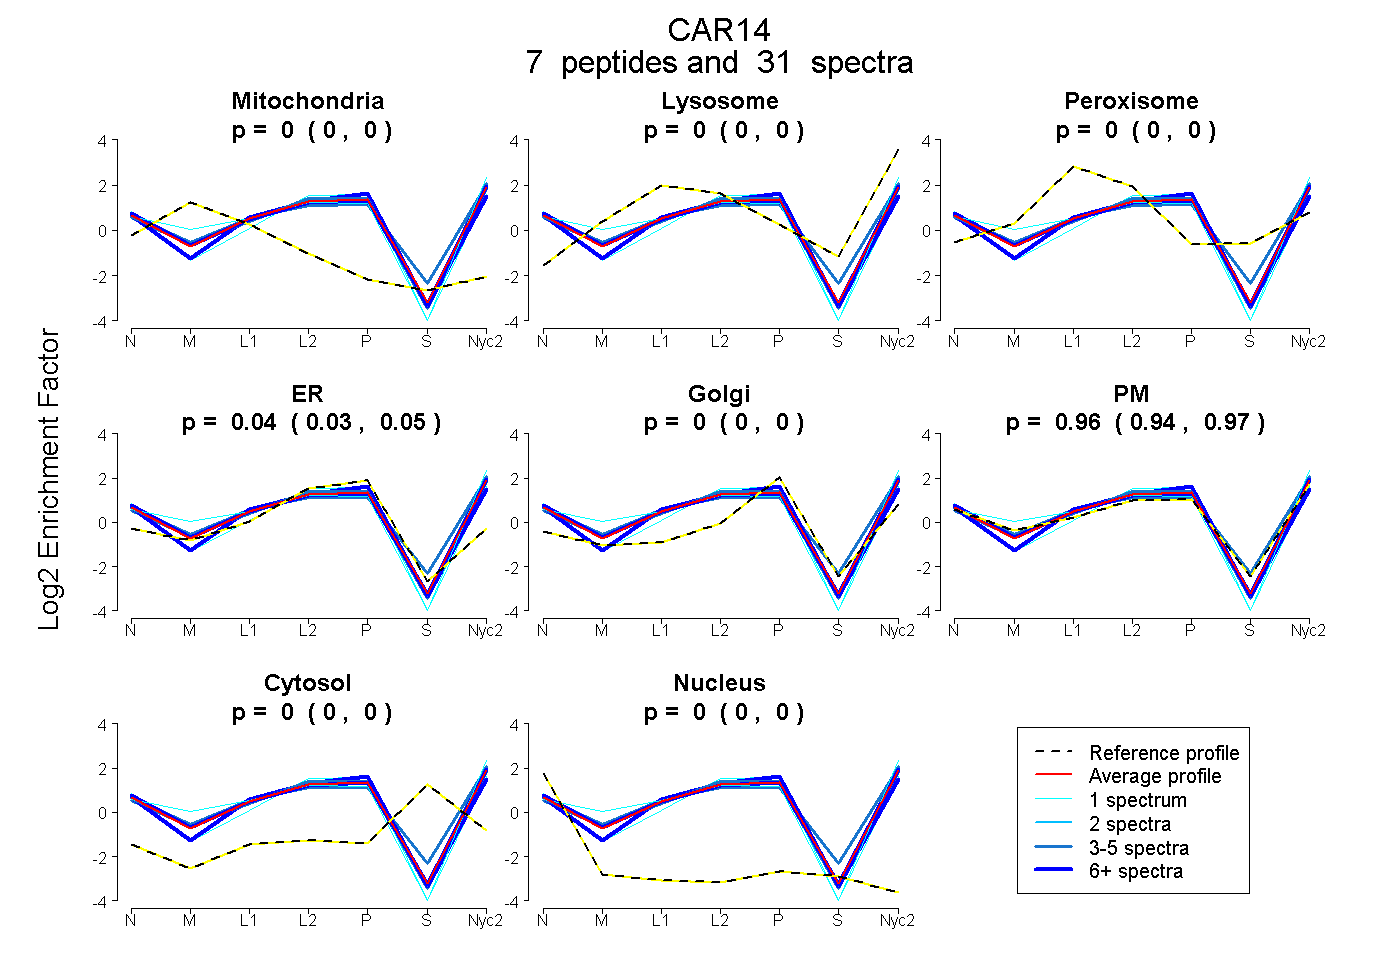
| Expt A |
7 peptides |
31 spectra |
|
0.000 0.000 | 0.000 |
0.000 0.000 | 0.000 |
0.000 0.000 | 0.000 |
0.042 0.028 | 0.053 |
0.000 0.000 | 0.000 |
0.958 0.944 | 0.969 |
0.000 0.000 | 0.000 |
0.000 0.000 | 0.000 |
| 10 spectra, VPQPLNQR | 0.000 | 0.000 | 0.000 | 0.000 | 0.000 | 1.000 | 0.000 | 0.000 | ||
| 6 spectra, SVVFTSAR | 0.000 | 0.000 | 0.000 | 0.247 | 0.000 | 0.753 | 0.000 | 0.000 | ||
| 4 spectra, ELLPQQLEQFFR | 0.000 | 0.000 | 0.000 | 0.048 | 0.000 | 0.952 | 0.000 | 0.000 | ||
| 5 spectra, AQISMGQLEK | 0.000 | 0.088 | 0.000 | 0.000 | 0.000 | 0.912 | 0.000 | 0.000 | ||
| 4 spectra, TSVPPFNVR | 0.000 | 0.000 | 0.000 | 0.005 | 0.000 | 0.995 | 0.000 | 0.000 | ||
| 1 spectrum, YTAAQLHLHWGQK | 0.000 | 0.000 | 0.000 | 0.000 | 0.000 | 1.000 | 0.000 | 0.000 | ||
| 1 spectrum, LQETLSSTEEDPSEPLVQNYR | 0.000 | 0.000 | 0.000 | 0.248 | 0.000 | 0.752 | 0.000 | 0.000 |
| Plot | Mito | Lyso or Perox | ER | Golgi | PM | Cytosol | Nucleus | ||||||
| Expt B |
4 peptides |
9 spectra |
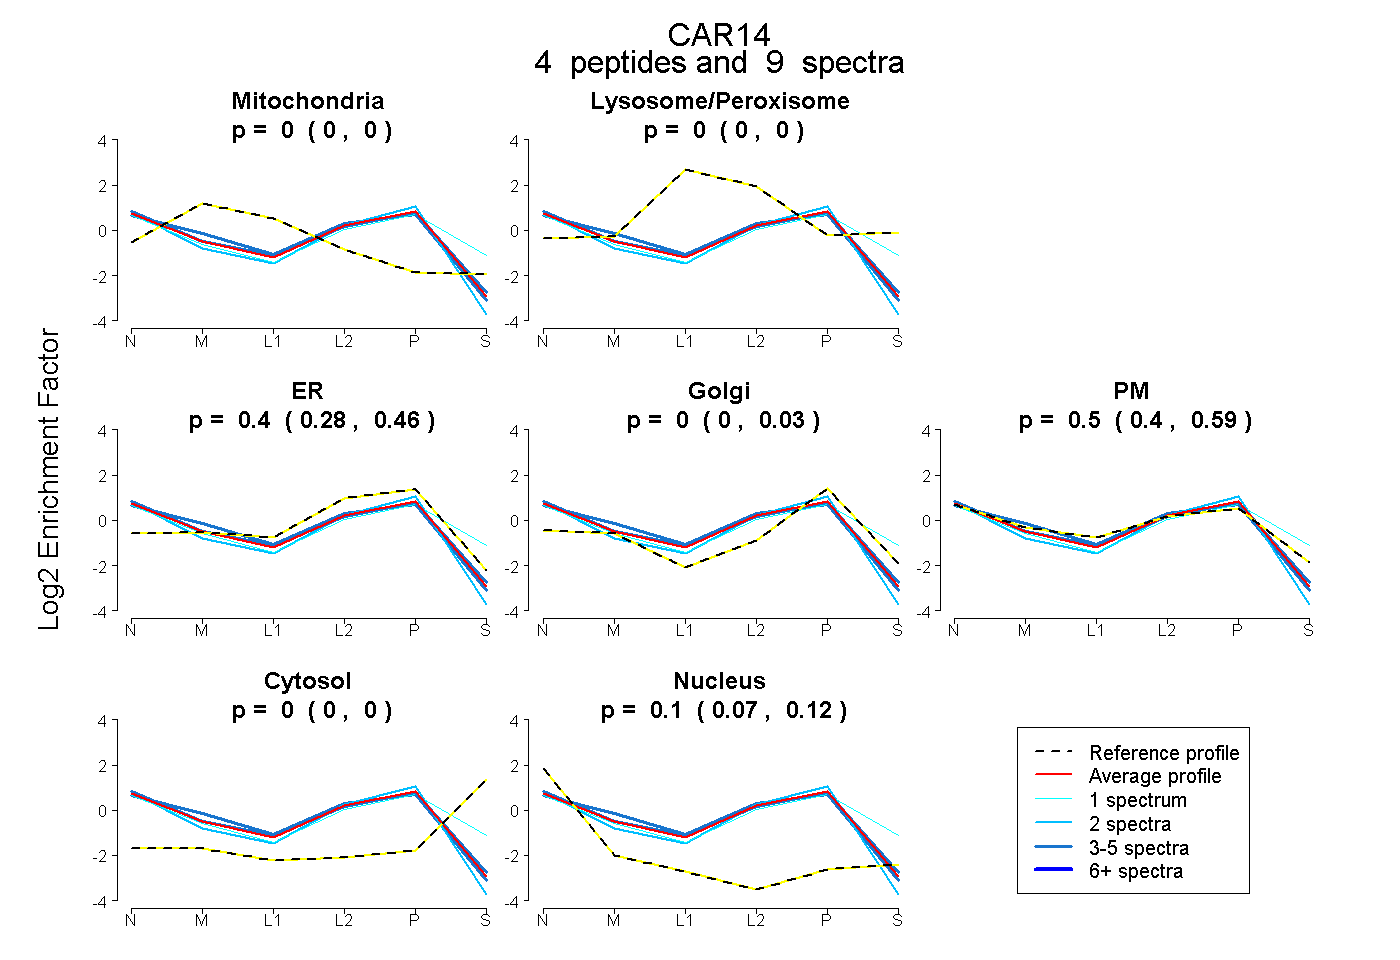 |
0.000 0.000 | 0.000 |
0.000 0.000 | 0.000 |
0.400 0.284 | 0.463 |
0.000 0.000 | 0.034 |
0.498 0.399 | 0.588 |
0.000 0.000 | 0.000 |
0.102 0.066 | 0.122 |
|||
| Plot | Lyso | Other | |||||||||||
| Expt C |
6 peptides |
43 spectra |
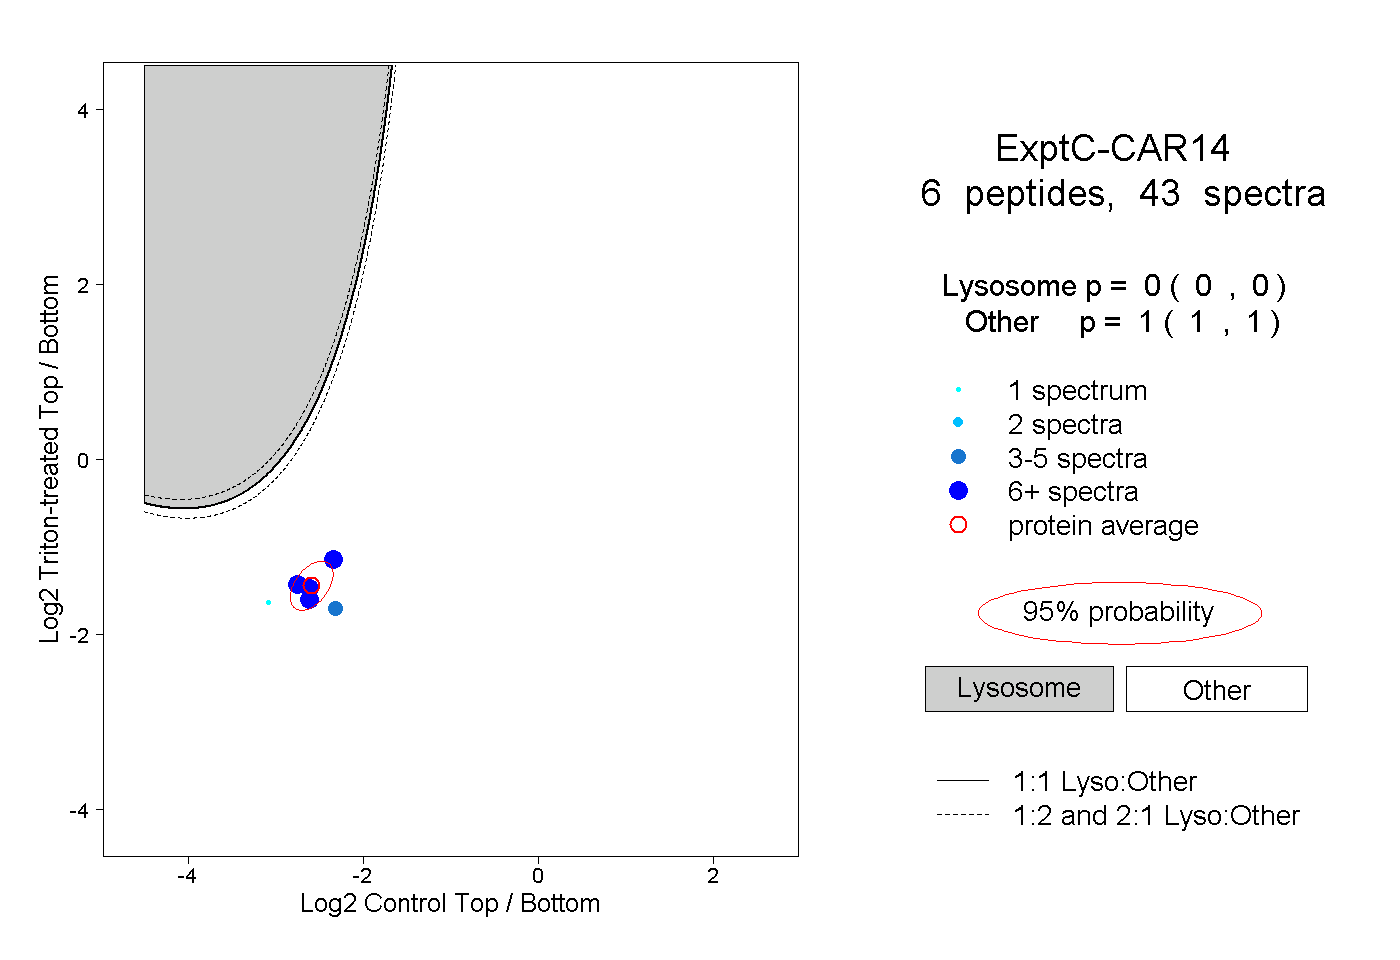 |
0.000 0.000 | 0.000 |
1.000 1.000 | 1.000 |
||||||||
| Plot | Lyso | Other | |||||||||||
| Expt D |
5 peptides |
8 spectra |
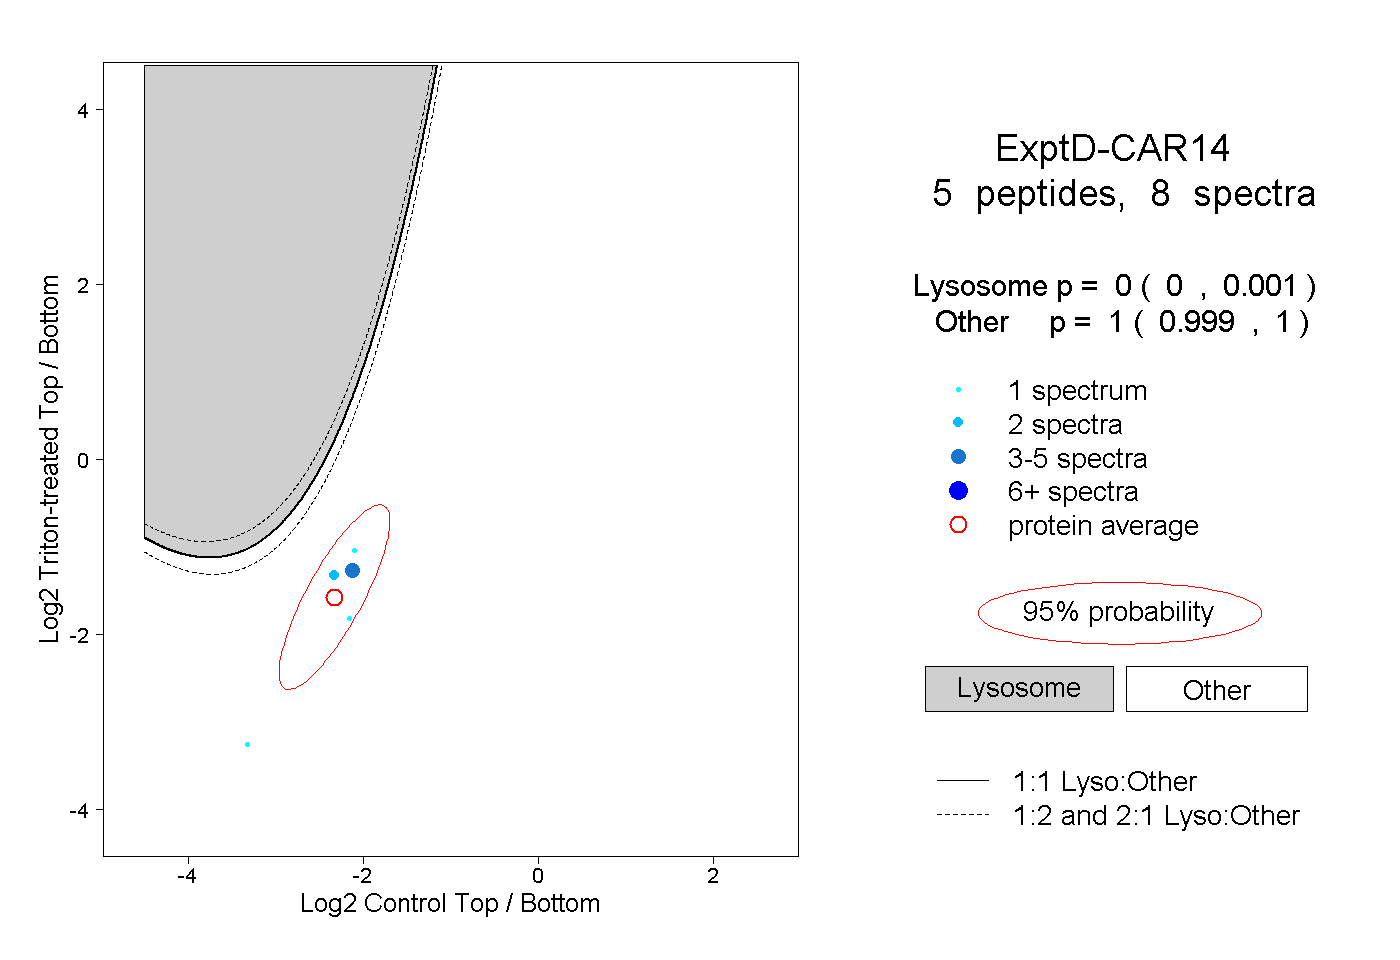 |
0.000 0.000 | 0.001 |
1.000 0.999 | 1.000 |