 5
5peptides
spectra
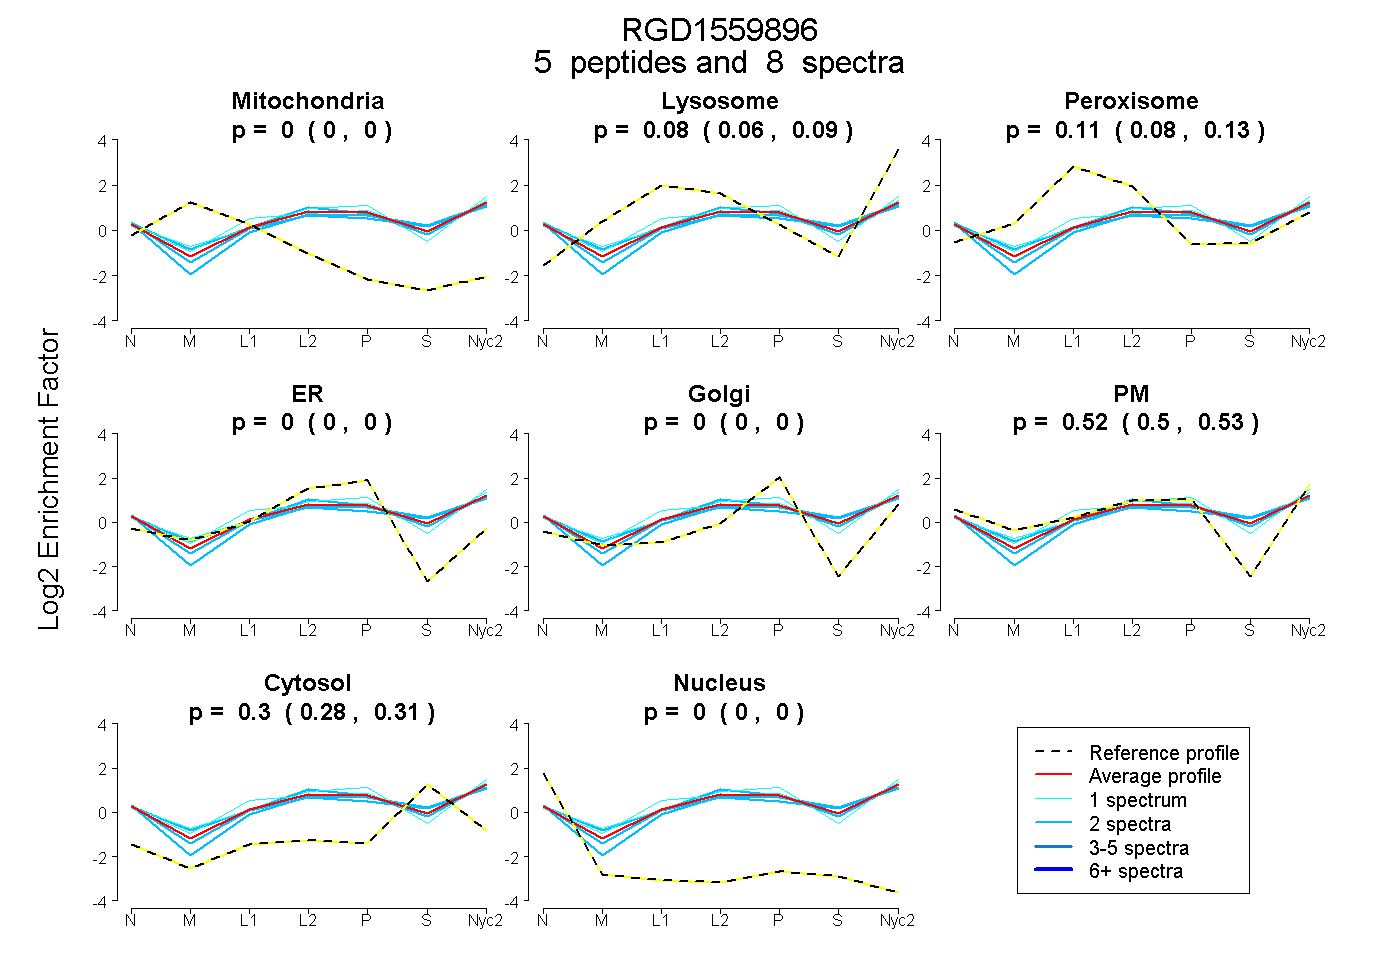
0.000 | 0.000
0.061 | 0.091
0.084 | 0.127
0.000 | 0.000
0.000 | 0.000
0.497 | 0.534
0.283 | 0.310
0.000 | 0.000
| Plot | Mito | Lyso | Perox | ER | Golgi | PM | Cytosol | Nucleus | |||||
| Expt A |
5 peptides |
8 spectra |
|
0.000 0.000 | 0.000 |
0.077 0.061 | 0.091 |
0.108 0.084 | 0.127 |
0.000 0.000 | 0.000 |
0.000 0.000 | 0.000 |
0.518 0.497 | 0.534 |
0.298 0.283 | 0.310 |
0.000 0.000 | 0.000 |
| 2 spectra, SSSLDALGPAR | 0.000 | 0.054 | 0.050 | 0.000 | 0.000 | 0.501 | 0.394 | 0.000 | ||
| 1 spectrum, VLPACYR | 0.000 | 0.121 | 0.158 | 0.000 | 0.000 | 0.464 | 0.257 | 0.000 | ||
| 2 spectra, LPPAQQDEIIDR | 0.000 | 0.037 | 0.134 | 0.000 | 0.000 | 0.471 | 0.358 | 0.000 | ||
| 2 spectra, CLVGPR | 0.000 | 0.067 | 0.140 | 0.000 | 0.000 | 0.537 | 0.256 | 0.000 | ||
| 1 spectrum, FTYFSSLSPMAR | 0.000 | 0.155 | 0.026 | 0.033 | 0.000 | 0.574 | 0.212 | 0.000 |
| Plot | Lyso | Other | |||||||||||
| Expt C |
4 peptides |
9 spectra |
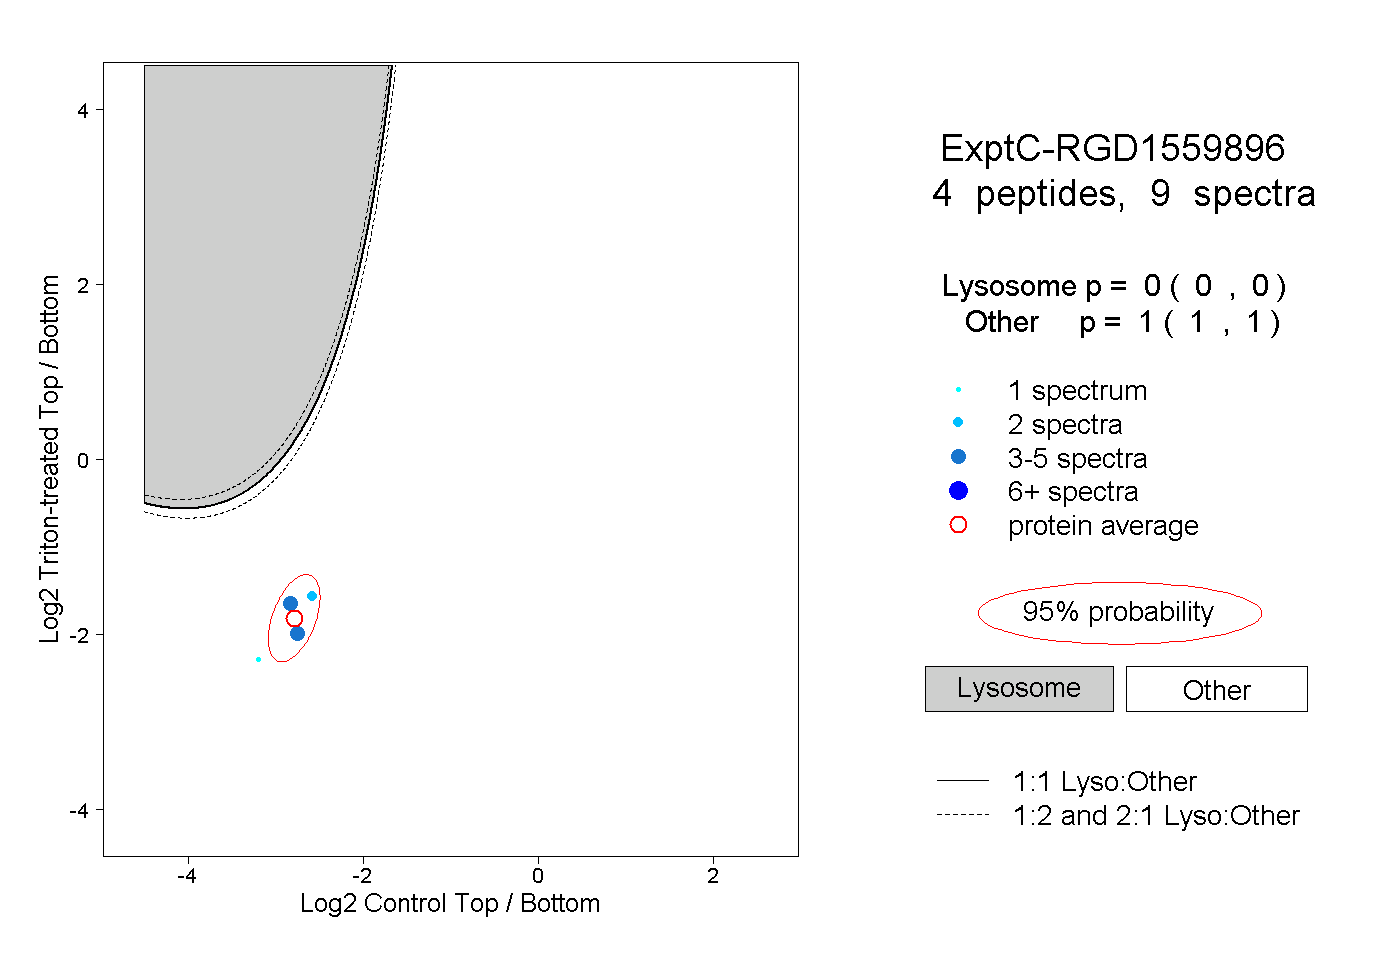 |
0.000 0.000 | 0.000 |
1.000 1.000 | 1.000 |