 7
7peptides
spectra
0.000 | 0.000
0.000 | 0.000
0.000 | 0.000
0.000 | 0.000
0.000 | 0.000
0.000 | 0.000
0.981 | 0.986
0.013 | 0.018
| Plot | Mito | Lyso | Perox | ER | Golgi | PM | Cytosol | Nucleus | |||||
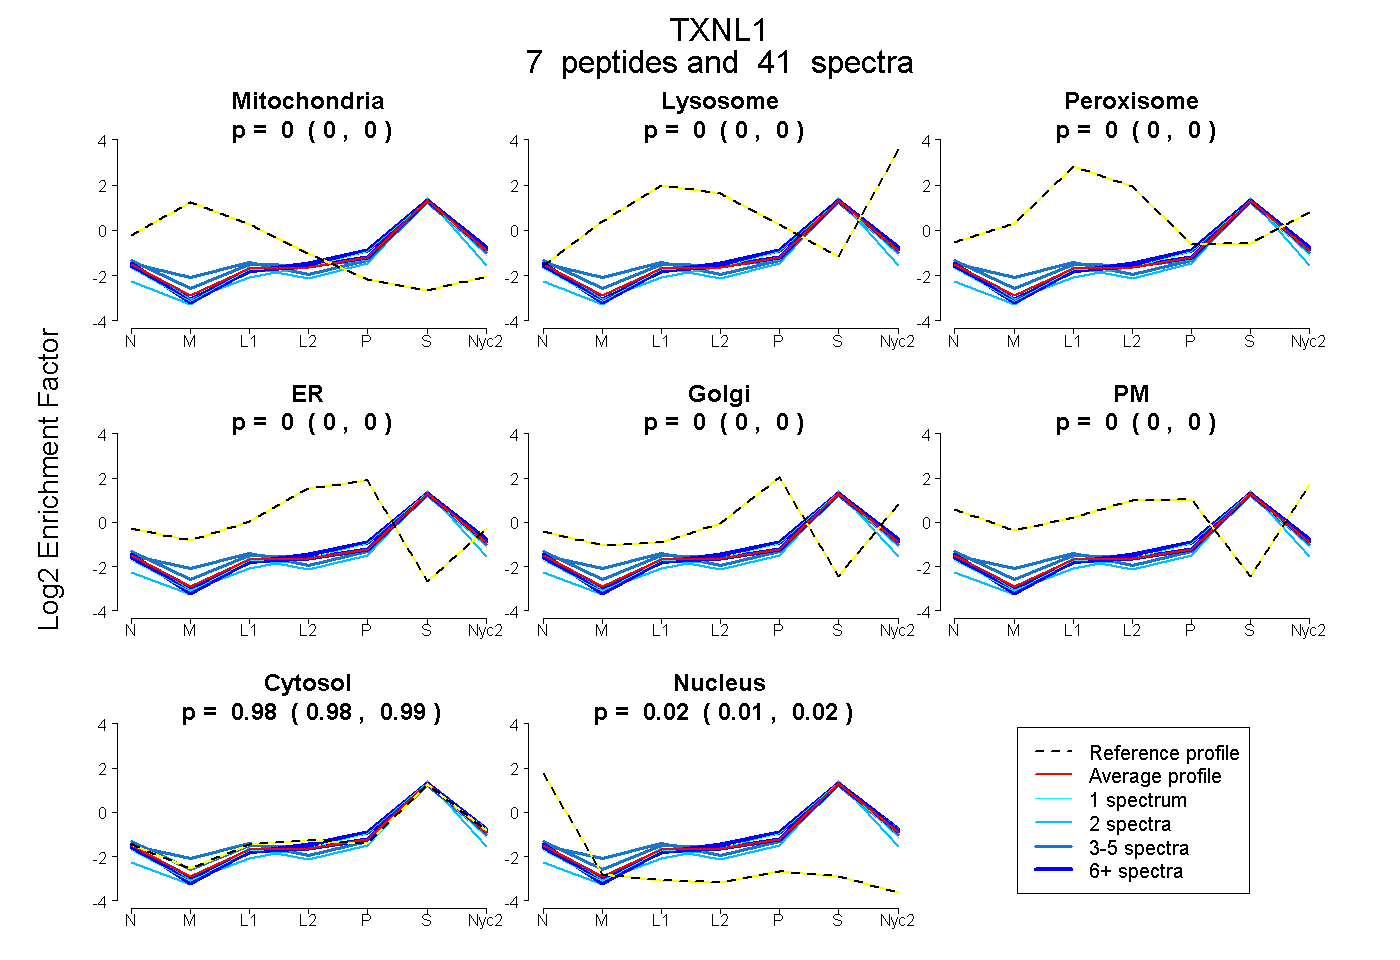
| Expt A |
7 peptides |
41 spectra |
|
0.000 0.000 | 0.000 |
0.000 0.000 | 0.000 |
0.000 0.000 | 0.000 |
0.000 0.000 | 0.000 |
0.000 0.000 | 0.000 |
0.000 0.000 | 0.000 |
0.984 0.981 | 0.986 |
0.016 0.013 | 0.018 |
| 1 spectrum, VGVKPVGSDPDFQPELSGAGSR | 0.000 | 0.000 | 0.000 | 0.000 | 0.000 | 0.000 | 0.993 | 0.007 | ||
| 6 spectra, IFINLPR | 0.000 | 0.000 | 0.000 | 0.000 | 0.006 | 0.000 | 0.994 | 0.000 | ||
| 2 spectra, GYMDLMPFINK | 0.000 | 0.000 | 0.000 | 0.000 | 0.000 | 0.000 | 0.978 | 0.022 | ||
| 20 spectra, SMDFEEAER | 0.000 | 0.000 | 0.000 | 0.000 | 0.000 | 0.000 | 0.981 | 0.019 | ||
| 5 spectra, FQGPDNGQGPK | 0.000 | 0.000 | 0.000 | 0.000 | 0.000 | 0.000 | 0.966 | 0.034 | ||
| 2 spectra, QHLENDPGSNEDTDIPK | 0.000 | 0.000 | 0.000 | 0.000 | 0.000 | 0.000 | 0.975 | 0.025 | ||
| 5 spectra, IAPAFSSMSNK | 0.043 | 0.000 | 0.000 | 0.000 | 0.000 | 0.000 | 0.956 | 0.001 |
| Plot | Mito | Lyso or Perox | ER | Golgi | PM | Cytosol | Nucleus | ||||||
| Expt B |
2 peptides |
7 spectra |
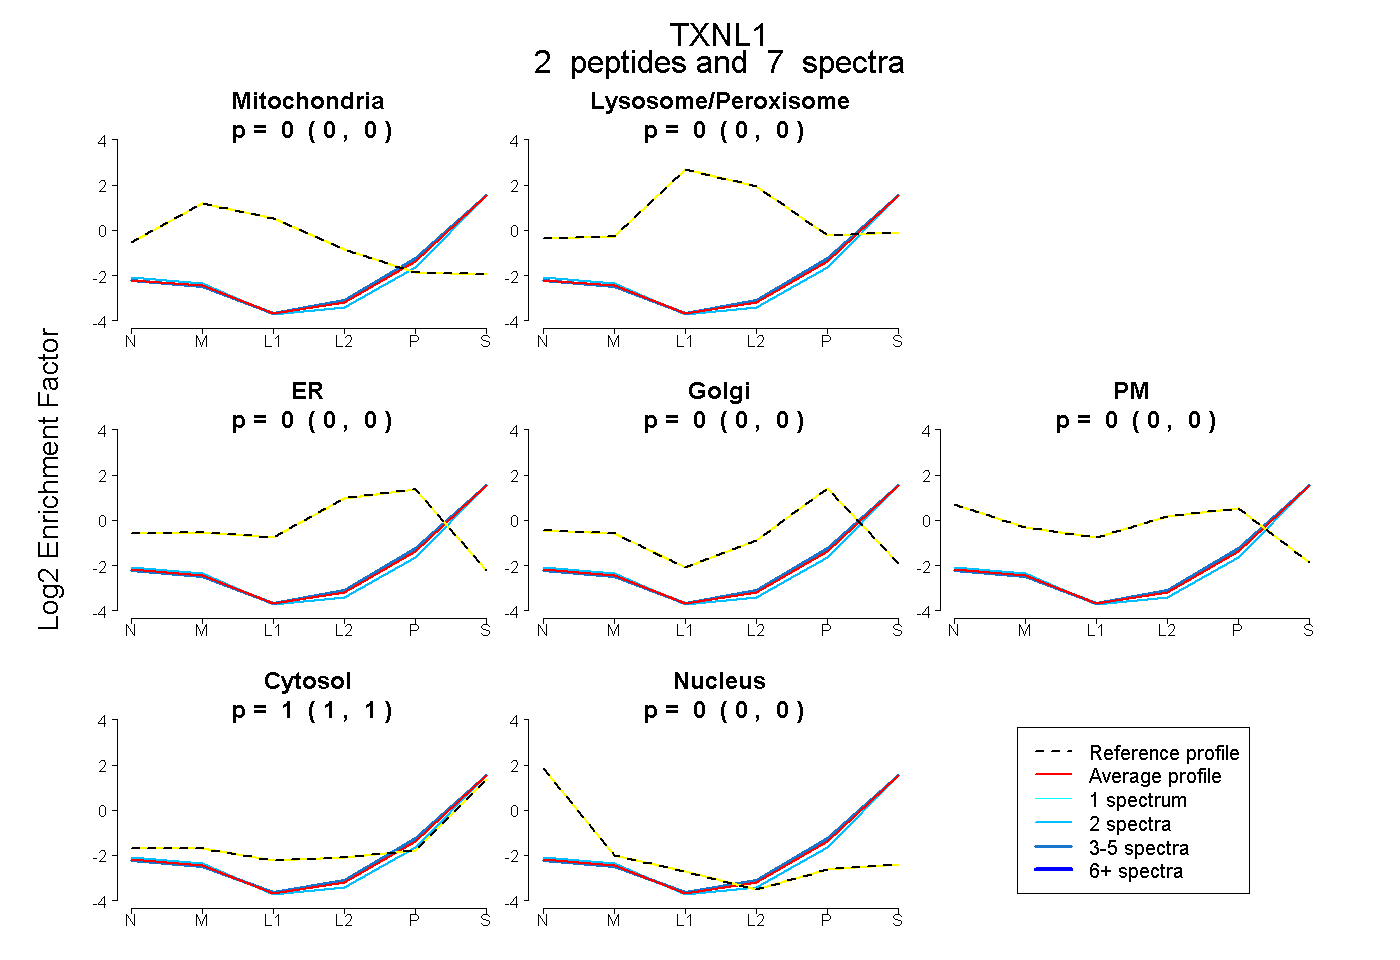 |
0.000 0.000 | 0.000 |
0.000 0.000 | 0.000 |
0.000 0.000 | 0.000 |
0.000 0.000 | 0.000 |
0.000 0.000 | 0.000 |
1.000 0.998 | 1.000 |
0.000 0.000 | 0.000 |
|||
| Plot | Lyso | Other | |||||||||||
| Expt C |
7 peptides |
37 spectra |
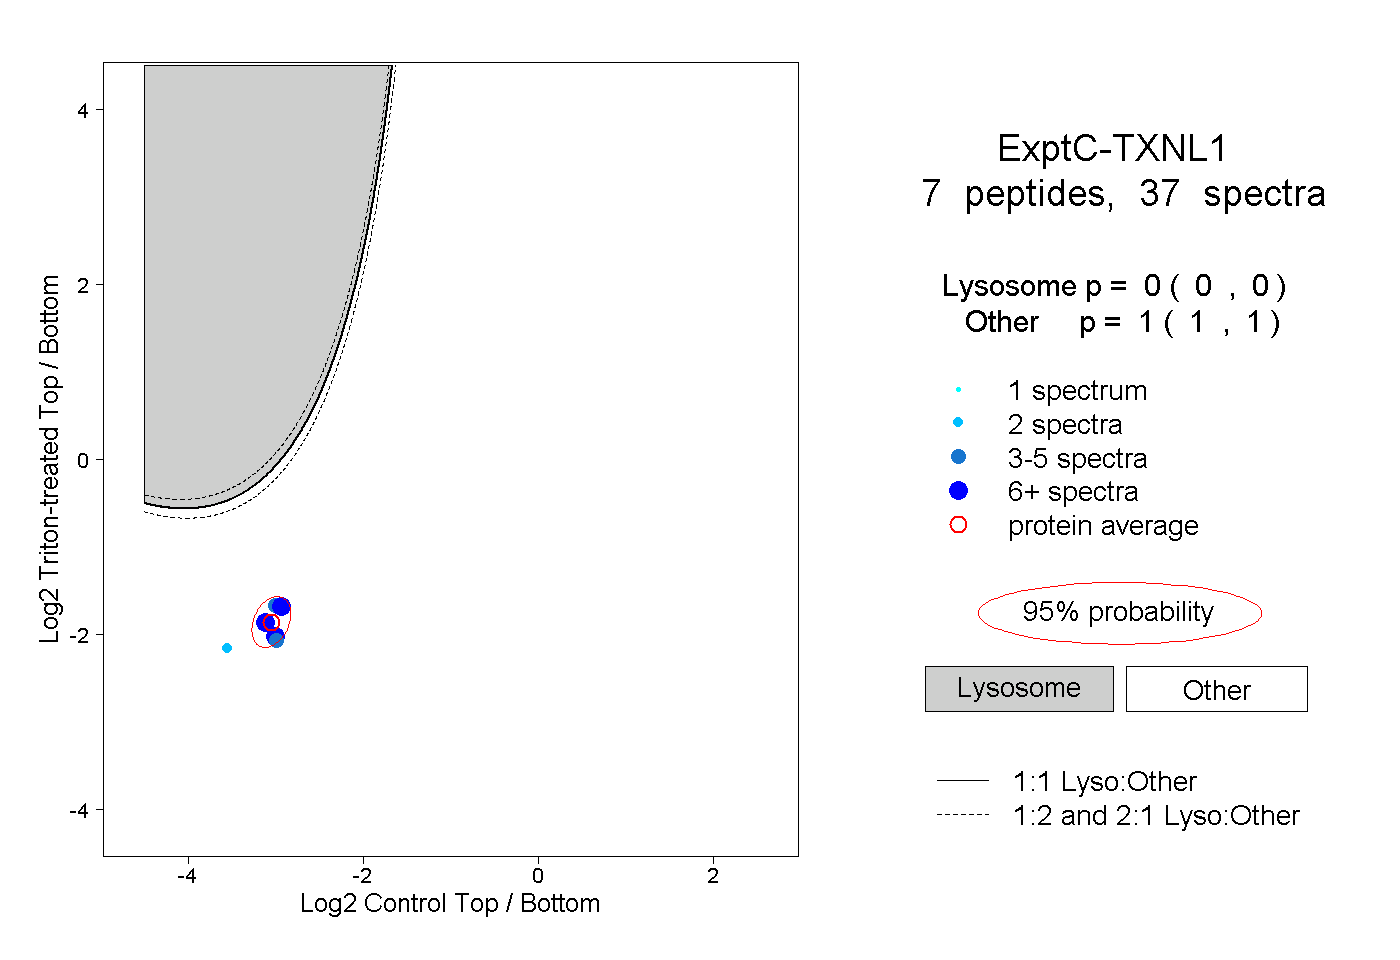 |
0.000 0.000 | 0.000 |
1.000 1.000 | 1.000 |
||||||||
| Plot | Lyso | Other | |||||||||||
| Expt D |
1 peptide |
1 spectrum |
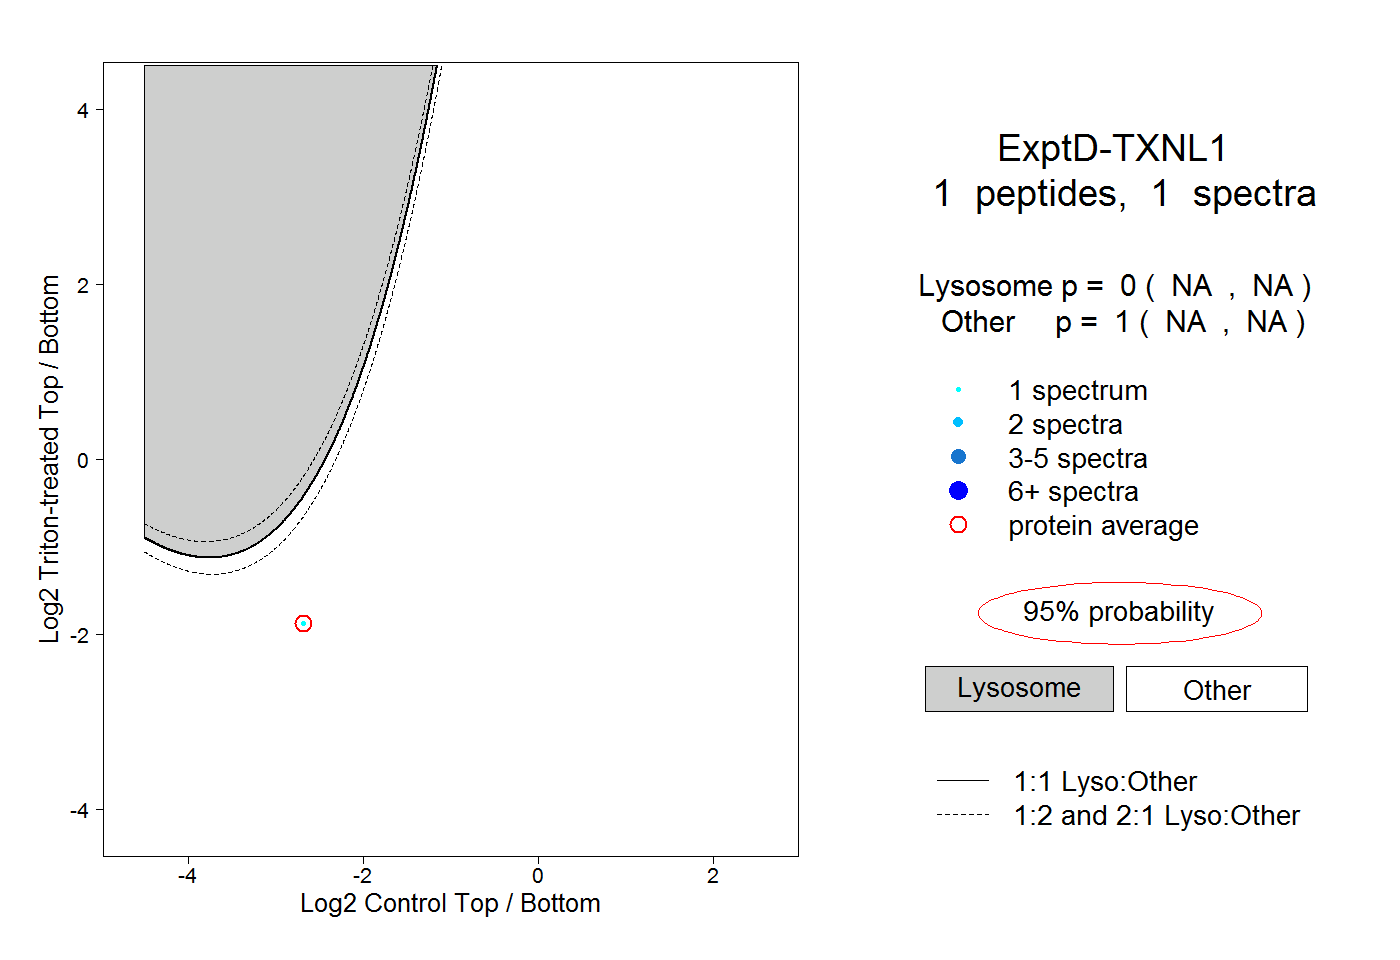 |
0.000 NA | NA |
1.000 NA | NA |