 10
10peptides
spectra
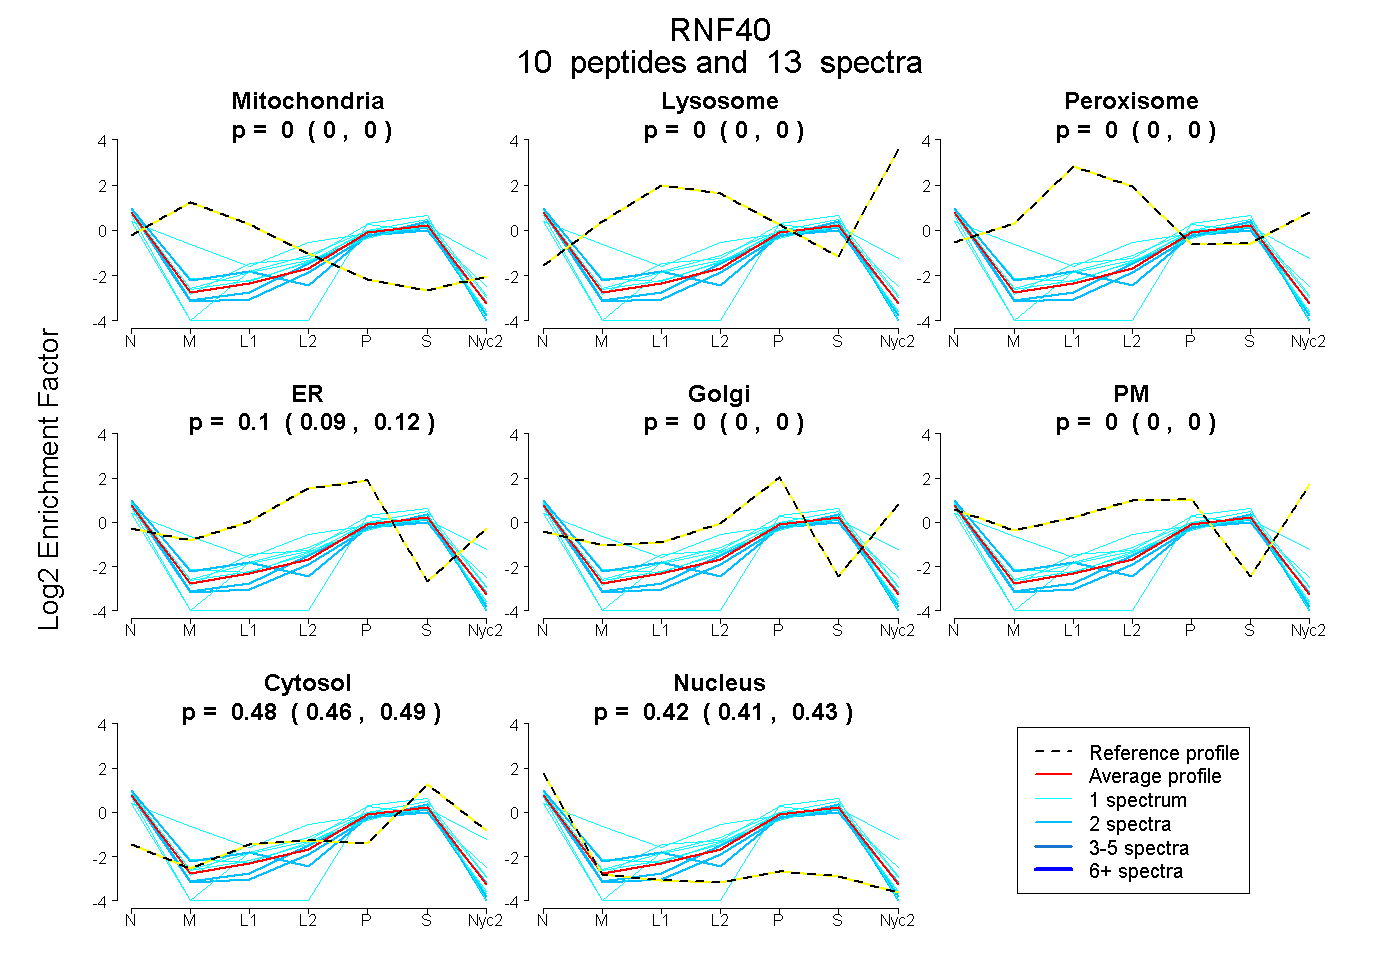
0.000 | 0.000
0.000 | 0.000
0.000 | 0.000
0.086 | 0.115
0.000 | 0.000
0.000 | 0.000
0.464 | 0.486
0.407 | 0.434
| Plot | Mito | Lyso | Perox | ER | Golgi | PM | Cytosol | Nucleus | |||||
| Expt A |
10 peptides |
13 spectra |
|
0.000 0.000 | 0.000 |
0.000 0.000 | 0.000 |
0.000 0.000 | 0.000 |
0.102 0.086 | 0.115 |
0.000 0.000 | 0.000 |
0.000 0.000 | 0.000 |
0.476 0.464 | 0.486 |
0.422 0.407 | 0.434 |
| 1 spectrum, IADEDALR | 0.000 | 0.000 | 0.000 | 0.242 | 0.000 | 0.000 | 0.431 | 0.327 | ||
| 1 spectrum, GLLLASK | 0.000 | 0.000 | 0.000 | 0.140 | 0.000 | 0.000 | 0.418 | 0.442 | ||
| 1 spectrum, VVEASDR | 0.000 | 0.000 | 0.000 | 0.132 | 0.000 | 0.000 | 0.504 | 0.364 | ||
| 2 spectra, TTTTLIEPIR | 0.000 | 0.000 | 0.000 | 0.102 | 0.000 | 0.000 | 0.428 | 0.470 | ||
| 1 spectrum, ESELLK | 0.000 | 0.000 | 0.000 | 0.102 | 0.000 | 0.000 | 0.574 | 0.324 | ||
| 1 spectrum, AEVDELR | 0.000 | 0.000 | 0.000 | 0.170 | 0.000 | 0.000 | 0.383 | 0.447 | ||
| 2 spectra, GDSEAPGEVAR | 0.000 | 0.000 | 0.000 | 0.069 | 0.000 | 0.000 | 0.435 | 0.496 | ||
| 1 spectrum, QAEEQIEHLQR | 0.107 | 0.000 | 0.000 | 0.188 | 0.000 | 0.118 | 0.481 | 0.105 | ||
| 2 spectra, AVEAAQLAEDLK | 0.000 | 0.000 | 0.000 | 0.000 | 0.000 | 0.000 | 0.488 | 0.512 | ||
| 1 spectrum, TEVIQLEDTLAQVR | 0.000 | 0.000 | 0.000 | 0.000 | 0.000 | 0.000 | 0.425 | 0.575 |
| Plot | Mito | Lyso or Perox | ER | Golgi | PM | Cytosol | Nucleus | ||||||
| Expt B |
1 peptide |
1 spectrum |
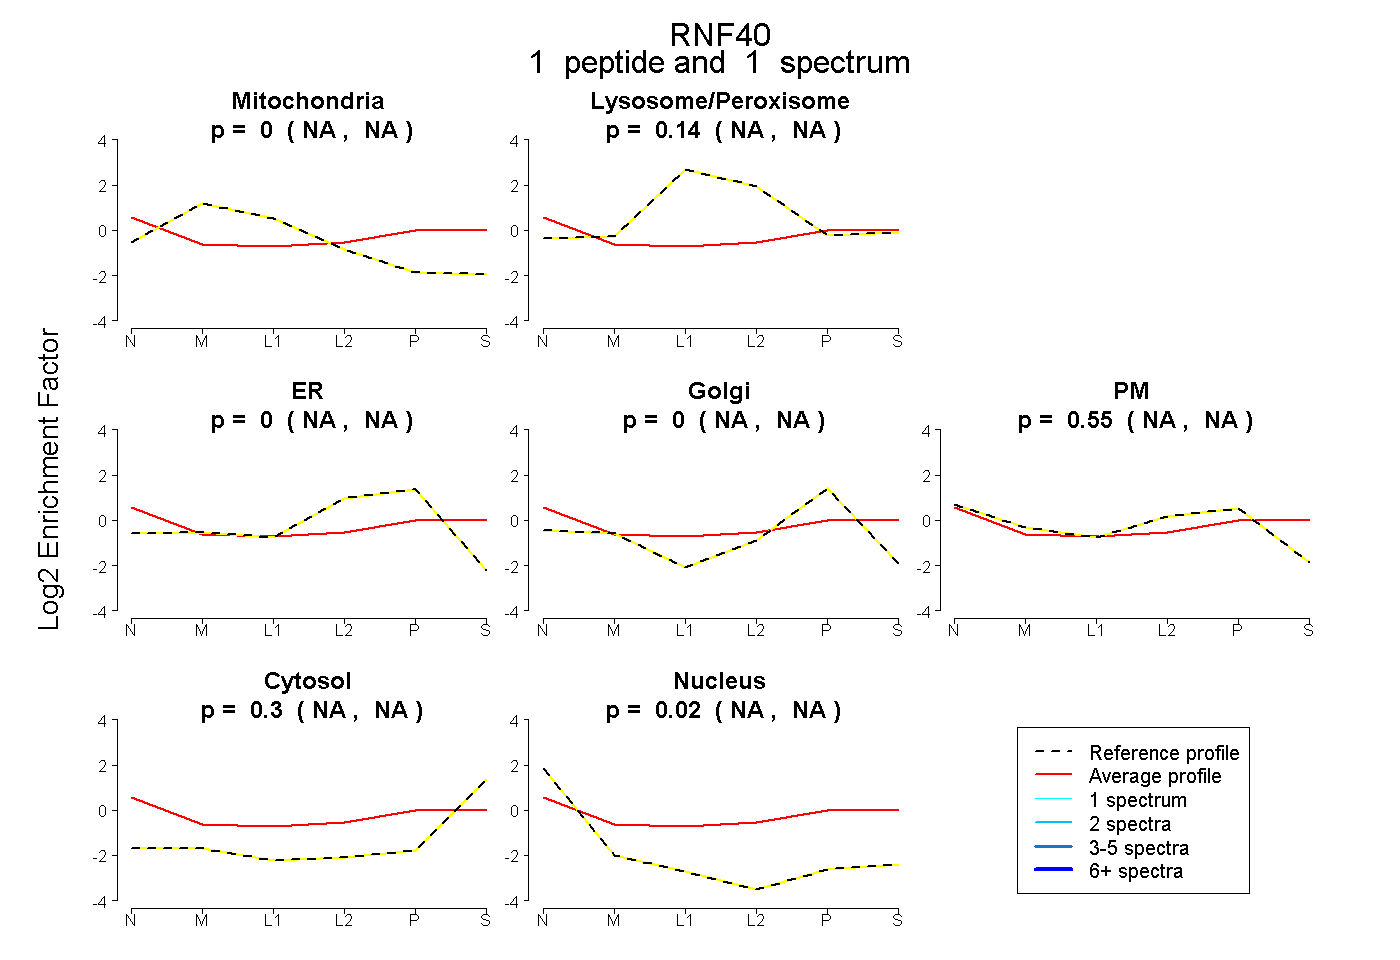 |
0.000 NA | NA |
0.140 NA | NA |
0.000 NA | NA |
0.000 NA | NA |
0.545 NA | NA |
0.297 NA | NA |
0.018 NA | NA |
|||
| Plot | Lyso | Other | |||||||||||
| Expt C |
1 peptide |
1 spectrum |
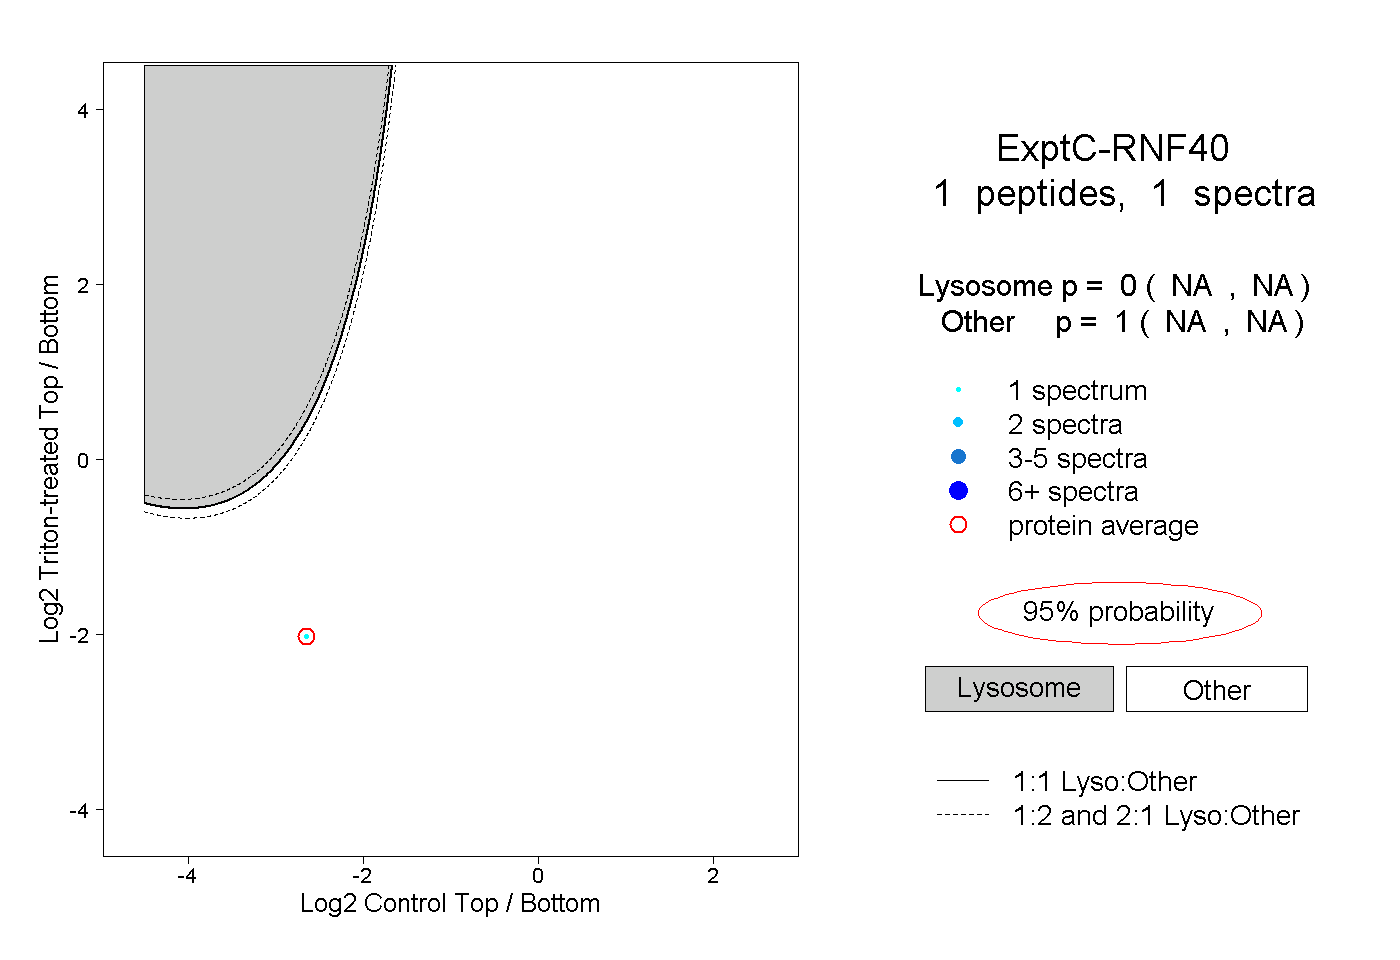 |
0.000 NA | NA |
1.000 NA | NA |