 5
5peptides
spectra
0.000 | 0.070
0.000 | 0.002
0.000 | 0.149
0.000 | 0.433
0.000 | 0.212
0.000 | 0.399
0.297 | 0.499
0.000 | 0.063
3peptides
spectra
0.000 | 0.000
1.000 | 1.000
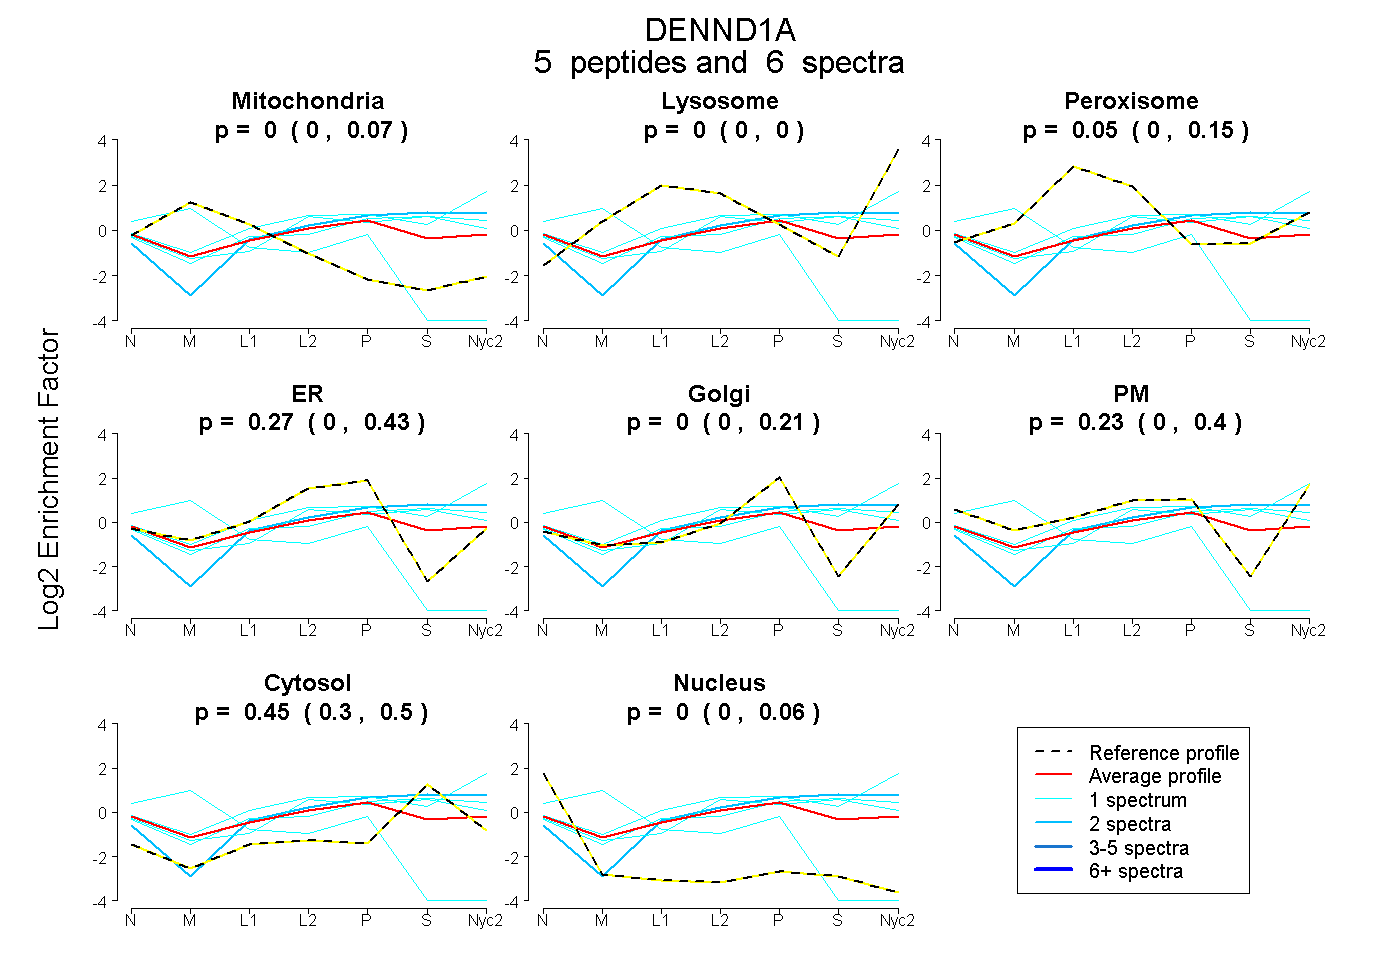
| Plot | Mito | Lyso | Perox | ER | Golgi | PM | Cytosol | Nucleus | |||||
| Expt A |
5 peptides |
6 spectra |
|
0.000 0.000 | 0.070 |
0.000 0.000 | 0.002 |
0.050 0.000 | 0.149 |
0.269 0.000 | 0.433 |
0.002 0.000 | 0.212 |
0.231 0.000 | 0.399 |
0.447 0.297 | 0.499 |
0.000 0.000 | 0.063 |
||
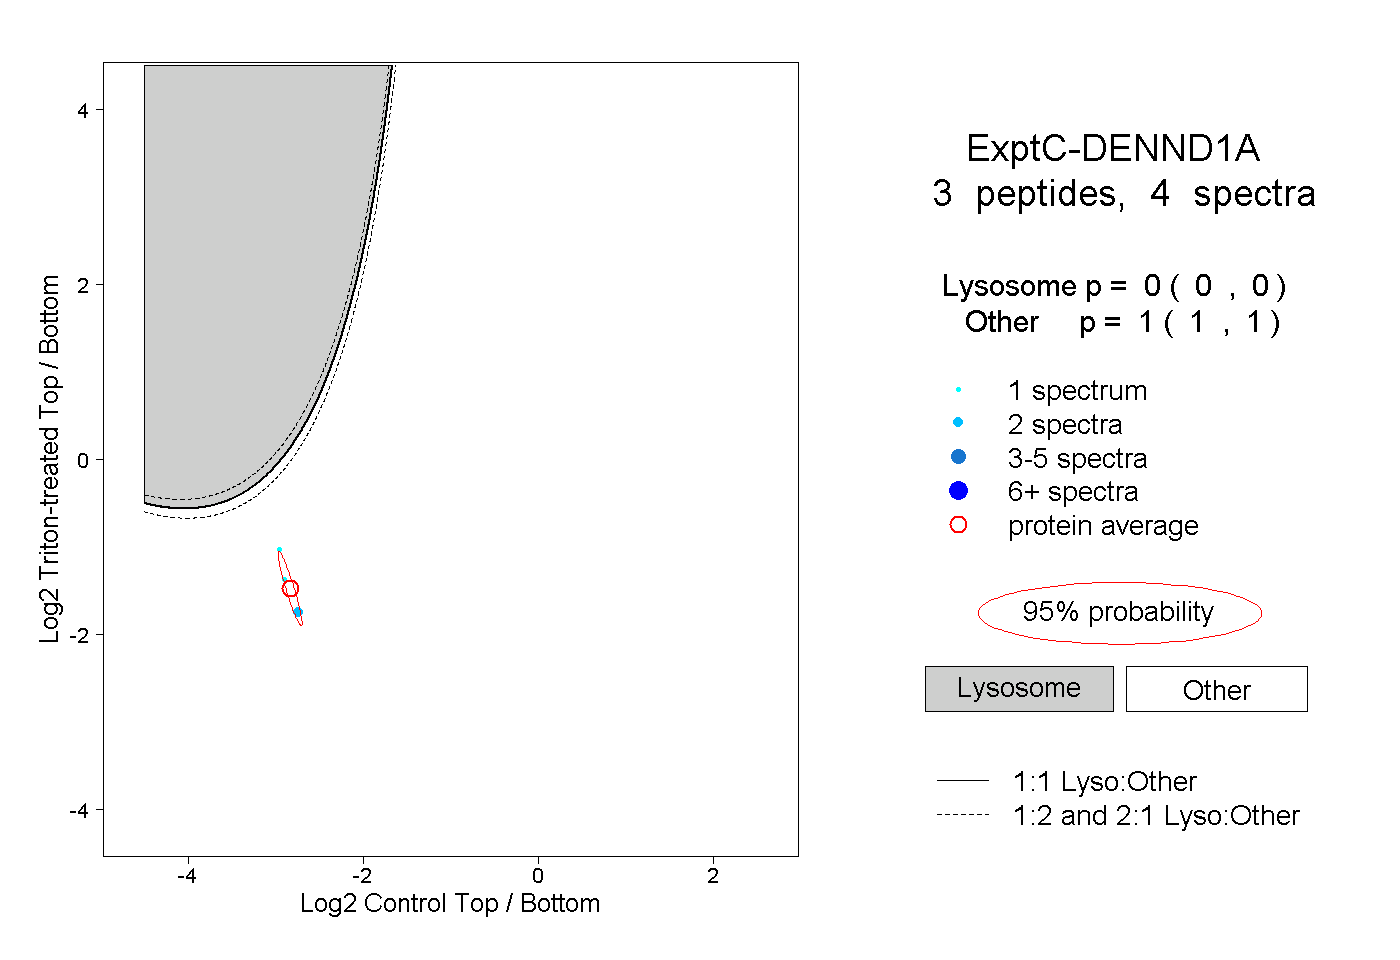
| Plot | Lyso | Other | |||||||||||
| Expt C |
3 peptides |
4 spectra |
|
0.000 0.000 | 0.000 |
1.000 1.000 | 1.000 |